Table of Contents
Data has become one of the most strategic assets for modern enterprises, yet without a clear big data strategy, even the most advanced systems and datasets sit idle and get disconnected from real business outcomes. Among the enterprises that invest in big data, fewer than 30% actually have a defined analytics strategy to turn that data into actionable insights. This leads to a paradox: companies must deal with more data than ever, yet they have a limited understanding of how to use it effectively.
A well-defined big data strategy shifts this dynamic. It integrates data collection, processing, and analytics into a single system designed to align with business priorities. Instead of chasing isolated KPIs, organizations use data to identify inefficiencies, predict risks, and measure the impact of decisions in real-time.
SoftTeco provides big data services that help companies build and scale their product data strategies, delivering value with long-term impact. In our article, we outline how to create an end-to-end foundation, what to prioritize first, and the common pitfalls to avoid.

What is a big data strategy, and why does it matter?
A big data strategy is a structured roadmap that defines how an organization collects, manages, analyzes, and operationalizes data. Companies use it to achieve business goals, such as faster time-to-decision, lower cost-to-serve, higher customer lifetime value, tighter risk controls, and shorter cycle times. It aligns technology, people, and processes into one system that turns information into continuous value creation.
Having analytics tools or cloud storage is not the same as having a strategy in place, as it dictates why, how, and where that data creates impact. Without this alignment, companies accumulate data lakes that rarely produce outcomes. A proper data strategy ensures that every dataset serves a defined business function, whether it’s reducing churn, forecasting demand, or optimizing production costs.
Data-driven enterprises significantly outperform their peers in terms of customers acquisition and profitability, demonstrating that consistent data management has a direct impact on competitiveness and resilience. A mature strategy ensures that information flows into product design, logistics, finance, and customer experience, where it can drive tangible change.
To make this work, many organizations rely on partners who build scalable data foundations and applied analytics.
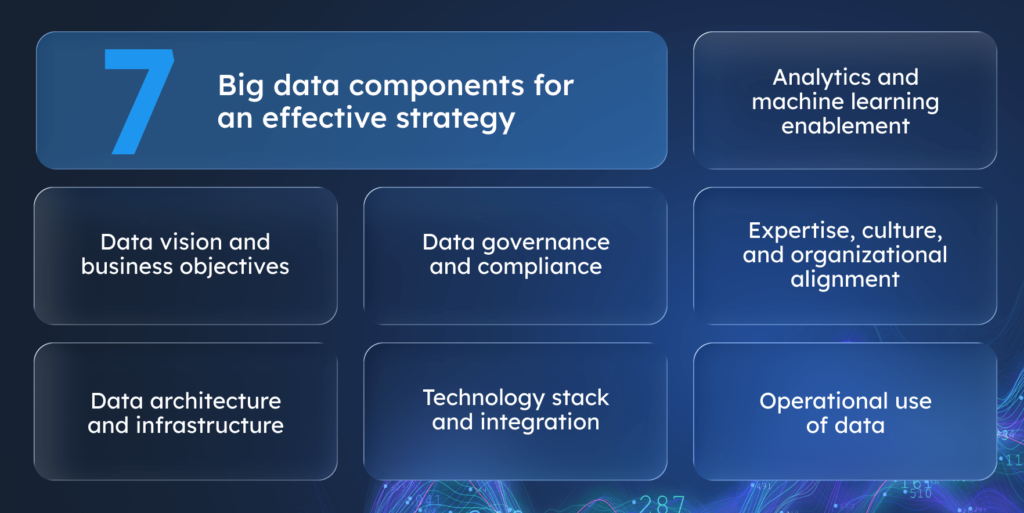
7 Big data components for an effective strategy
To make a big data strategy operational, companies need more than high-level intent, they need a functional framework. This framework consists of interconnected components that define how data is collected, processed, governed, and turned into business value. Below, we break down the six core components that form the foundation of an effective big data strategy.

Data vision and business objectives
An effective big data strategy starts with a clear data vision, which is a statement of what the company wants to achieve and how data supports that goal. Without it, teams collect information endlessly but never translate it into outcomes. Moreover, business objectives define what data is valuable, how often it should be updated, and which metrics will measure success.
For example, a company focused on optimizing supply chain costs will prioritize collecting logistics, inventory, and lead-time data, while a business aiming to improve customer lifetime value will invest in behavioral analytics, churn modeling, and personalization systems. The data vision acts as a filter, as it connects data collection directly to business intent, ensuring that analytics lead to improvements rather than just creating more reports.
With clear objectives, data teams can connect each dataset to a performance goal, resulting in fewer delays, higher margins, better retention, or faster product cycles. This way, data becomes a real strategic asset.
Data architecture and infrastructure
A modern big data strategy relies on a multi-layered architecture that ensures reliable, scalable, and efficient data flow from collection to analytics:
- Ingestion Layer collects structured and unstructured data from multiple sources via connectors and streaming mechanisms.
- Storage Layer stores raw data in scalable and cost-efficient object storage systems (data lakes), supporting future processing needs.
- Processing and Transformation Layer cleans, joins, and prepares data using distributed computing frameworks, often applying SQL-based transformations.
- Analytical Layer delivers prepared data to business intelligence tools and dashboards through high-performance warehouses or real-time databases.
- Orchestration Layer coordinates workflows across all stages, managing dependencies, retries, and data freshness.
As for the cloud or on-premises infrastructure, the choice depends on scalability and compliance needs. Platforms such as AWS, Azure, and GCP enable elastic scaling and faster deployment, while on-premises setups provide companies with tighter control over sensitive assets.
The best designs often use hybrid models, which implies keeping regulated data local and leveraging the cloud for compute-intensive analytics. With real-time access layers and high-availability configurations, teams can analyze trends as they occur, rather than waiting for daily reports. This architecture turns data from a stored asset into a live system that fuels decisions.
Data governance and compliance
Once the vision is set, data governance establishes the rules: who owns which data, who can access it, and how accuracy and privacy are maintained. Without it, even the most advanced analytics quickly degrade into noise.
To maintain trust and control, data must be processed and stored in line with industry standards like GDPR, CCPA, and ISO 27001. As part of a big data strategy, companies implement governance frameworks to automate data validation, access control, and audit readiness. These frameworks define ownership, enforce privacy, and ensure that every record is accurate, traceable, and versioned. They also manage data lineage and change history, so teams always know how data moves and transforms. Without this layer, even advanced analytics lose reliability and introduce risk.
Technology stack and integration
A robust technology stack ensures that data processing, transformation, and analysis remain scalable and efficient across the entire pipeline. Core platforms such as Apache Spark and Kafka process and stream high-volume data in real time, feeding into cloud data warehouses like Snowflake, BigQuery, or Redshift, or into analytical databases such as ClickHouse for low-latency querying. Tools like dbt (data build tool) manage data transformation with version control and testing, while orchestrators such as Airflow or Dagster coordinate complex workflows and resolve interdependencies between tasks.
Equally important is integration both between internal data layers and with external systems. Enterprises often run a mix of legacy and modern platforms, including ERP, CRM, and BI tools. API-based integration and microservices help bridge these environments, enabling consistent data exchange and reducing the need for manual syncing. This brings all data sources together and keeps systems working consistently. It also ensures that the right information reaches the right place, whether that’s a sales dashboard, a financial report, or a customer-facing application. As a result, teams no longer deal with mismatched data or wait for manual updates, because everyone sees the same accurate and up-to-date numbers.
Analytics and machine learning enablement
This component ensures that data transforms into decisions, both human and automated. It includes reporting, dashboards, machine learning models, and system integration.
- For business intelligence (BI), data engineers and analysts build analytical marts and semantic models to power dashboards and KPI reports. Business users access tools like Power BI or Looker to monitor performance and investigate trends.
- While dealing with machine learning, data scientists use curated datasets to train predictive and classification models for tasks like demand forecasting, fraud detection, or customer churn. These models rely on well-prepared, consistent data pipelines.
- To ensure data readiness for AI, engineers set up automated pipelines for feature engineering, model training, and retraining, ensuring that models stay accurate as new data flows in.
- For operational integration, developers integrate model outputs into business systems like CRMs, ERPs, recommendation engines, so predictions can drive actions without manual intervention.
- MLOps teams track model performance in production and trigger retraining or tuning as needed, maintaining accuracy and business value over time.
Expertise, culture, and organizational alignment
Even the most advanced data stack fails without people who can use it. Building a data-driven culture means treating analytics as a shared language across departments. Executives base strategies on measurable evidence, while marketing, finance, and operations teams use dashboards and metrics to make everyday decisions.
Upskilling is critical to making data usable across teams. It starts with training on tools like dashboards, SQL, and basic analytics so teams can read and act on insights without relying on specialists. To support this shift, companies often appoint individuals within each department who take on responsibility for promoting data use, for example, helping colleagues interpret reports or define metrics. These internal advocates, combined with literacy programs and space for experimentation, help build trust in data and reduce resistance to metrics.
When culture, skills, and leadership align, data stops being a side project and becomes the foundation of how the entire organization thinks and acts.
Operational use of data
Not all data exists for analytics or machine learning, as a large part powers day-to-day business operations. This includes user profiles in web apps, real-time inventory updates, financial transactions, and personalized content in client portals. These use cases rely on low-latency, reliable access to clean, structured data. Data engineers build and maintain these flows, ensuring that APIs, event streams, and databases stay in sync with business logic. A mature data strategy must account for these transactional needs, where performance, availability, and consistency are just as important as insight.
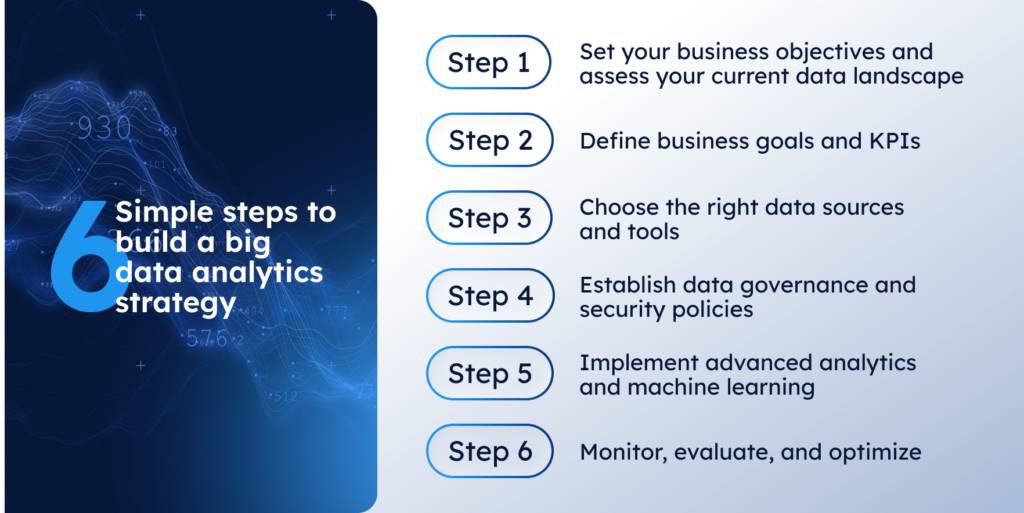
6 Simple steps to build a big data analytics strategy
A strategy for big data use is not a single document but a sequence of deliberate steps. Each step transforms raw, fragmented information into a managed asset that supports measurable business goals. SoftTeco provides big data consulting services to help companies navigate these steps from assessing their current data landscape to implementing advanced analytics, optimizing pipelines, and ensuring operational integration. Below is a structured, repeatable process used by mature data organizations.

Step 1: Set your business objectives and assess your current data landscape
Let’s start with clear business objectives for your effective big data strategy. First, you need to define what you’re trying to achieve, whether it’s reducing churn, optimizing supply chains, improving customer lifetime value, or increasing operational visibility. These goals will determine what data matters, how often it should be updated, and which metrics define success.
Once objectives are defined, assess your current data landscape. You need to run a maturity assessment across key dimensions: data sources, ingestion methods, storage infrastructure, governance policies, and team capabilities. Then, identify redundancies, undocumented integrations, and potential compliance risks. At this stage, you’ll have:
- A visual map of data flows (sources, storage, usage);
- A maturity score across categories such as availability, quality, security, and accessibility;
- A prioritized list of gaps and quick wins.
This diagnostic phase sets the baseline for all future investments and defines where effort will deliver the highest return.
Step 2: Define business goals and KPIs
You need to connect business outcomes to data goals. Collaborate with the heads of operations, marketing, and finance, to pinpoint where better data could make a visible impact. For example, if logistics costs keep rising, define a goal like “reduce average delivery time by 10%.” Your analytics team will then identify measurable KPIs to track progress.
At the end of this step, you should have:
- A list of business goals with numeric KPIs and target timelines;
- Decision owners assigned to each metric;
- Agreement on how results will be measured and reported.
Step 3: Choose the right data sources and tools
Once goals are clear, work with your data architects to align them with actual data assets. You’ll review the existing datasets, ranging from CRM and ERP systems to IoT sensors and API feeds, and determine which tools can handle them most efficiently.
The deliverable is a blueprint showing:
- A catalog of approved data sources with metadata and access paths;
- Tool selection rationale with estimated licensing or cloud costs;
- Preliminary architecture diagram, connecting ingestion, storage, and analytics layers.
Step 4: Establish data governance and security policies
This is where you formalize trust. You need to review policies that define who owns the data, who can access it, and under what conditions. Your governance and security teams should set clear standards for encryption, anonymization, and data quality thresholds. You also need to ensure the balance: data must be secure but still accessible to teams that need it.
The final documents include:
- Governance roles and responsibilities matrix;
- Data classification model and access-control schema;
- Security procedures for encryption, backup, and audit logging;
- Compliance alignment summary (GDPR, CCPA, ISO 27001, SOC 2, etc.).
Step 5: Implement advanced analytics and machine learning
This step is where things begin to produce value. You approve one high-impact pilot project, which is something measurable, such as demand forecasting or churn prediction. The data team builds the analytics or ML model, tests it, and presents outcomes in terms of business KPIs. Your role is to validate that insights are usable and connected to real decisions, not just another report. It’s also the point to align with your broader big data analytics strategy for future scaling.
Deliverables:
- Documented analytical workflow or model pipeline;
- Performance metrics (accuracy, precision, latency, cost);
- Integration summary showing how insights feed back into business systems.
Step 6: Monitor, evaluate, and optimize
Once the pilot is live, shift your focus to sustainability. Ask your team to set up dashboards for tracking data quality, model performance, and infrastructure costs. Schedule monthly or quarterly reviews to compare results against KPIs. Encourage the use of DataOps and MLOps frameworks to maintain routine and predictable updates. Over time, this process becomes part of normal operations rather than a special project.
A mature monitoring phase delivers:
- Unified performance dashboard;
- Documented feedback loops for data and model updates;
- MLOps/DataOps runbooks for deployment and rollback;
- Updated backlog of enhancements and new data opportunities.
Why most big data projects fail and how to build one that doesn’t
If I could give teams two pieces of advice when they tackle a Big Data strategy, these would be it: First, stop and draw the blueprints. It’s tempting to jump straight into development, but trust me, defining your data architecture early is non-negotiable. Trying to switch your core storage, processing frameworks, or scaling approach after the project is underway is painfully expensive and often leads to stagnation. You need to invest upfront in that forward-looking design to ensure your platform is built on a solid foundation, saving everyone headaches down the line.
And this leads directly into the second point: master your tools. When we’re dealing with massive datasets, selecting popular, well proven tools is only half the battle. True efficiency comes from knowing their inner workings, namely their specific limitations, optimization techniques, and advanced features. You can have the best framework in the world, but if your team hasn’t constantly educated themselves on how to use it optimally, you’ll end up wasting resources and throttling performance. Constant self-education on tool capabilities isn’t a bonus; it’s essential for achieving peak Big Data performance.
Finally, and this is crucial, we need to talk about data literacy and teamwork. Data isn’t just the pretty report we generate at the end; it’s the instrument and the input that actively drives our development and even our mission-critical transactional systems. Because of this, everyone needs a crystal-clear, shared understanding of the main datasets. Static documents just won’t cut it. We must foster that culture of open discussion and think more about periodic meetups and knowledge-sharing. When we have “silent development,” where teams make isolated assumptions, we end up with misaligned results and tons of unnecessary rework.
Ultimately, combining that robust architecture, tool mastery, and truly knowledgeable, communicative people are how you actually win with Big Data.
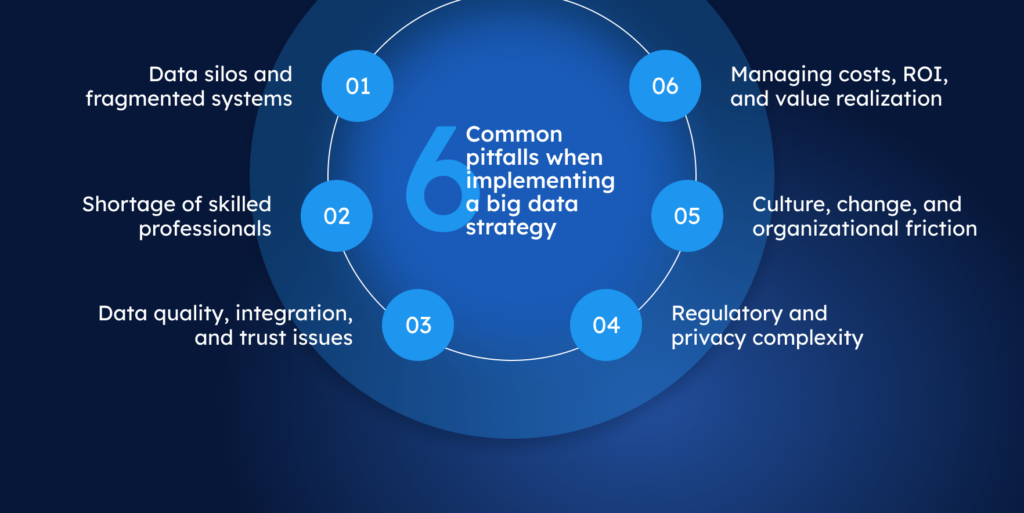
6 Common pitfalls when implementing a big data strategy

Data silos and fragmented systems
One recent study found that 82% of enterprises report data silos disrupt critical workflows, and 68% of data remains unanalyzed due to fragmentation.
This starts when departments build systems independently. Marketing, operations, and finance often define the same entities such as customers or accounts using different identifiers, schemas, and update cycles. Over time, these differences turn into barriers: teams become blind to entire segments of users or operations, analytics runs on partial data and produces biased conclusions, and security teams can’t track access across duplicates scattered in separate domains. To fix this, you need to ensure shared KPIs, unified ownership and data formats, and clear data-flow mapping.
Shortage of skilled professionals
Lack of skilled talent is one of the most persistent barriers to executing a big data strategy. According to surveys, 60% of companies cite talent shortages as a major roadblock to digital transformation. In particular, gaps in data engineering, analytics, and governance slow down progress, as teams struggle to build reliable pipelines, manage data quality, and deliver insights at scale.
As a result, projects stall at the preparation stage instead of generating business value. In parallel, 64% of organizations report poor data quality as a top challenge, which often reflects the absence of experienced professionals who can enforce standards and maintain clean, consistent data across systems. Without the right expertise, companies risk spending time and budget on infrastructure without turning data into impact.
Data quality, integration, and trust issues
Gartner estimates that poor data quality costs the average enterprise at least US$12.9 million per year. When models run on incomplete, inconsistent, or stale data, they fail or produce misleading insights. Integration adds even more friction when systems rely on different identifiers, formats, or time zones. As a result, decisions become slower and less accurate, while teams waste time fixing broken pipelines instead of analyzing outcomes. Over time, trust in analytics degrades, and businesses grow reluctant to rely on data at all.
For this problem, you need to build quality gates into pipelines, standardize keys and schemas, enable freshness checks, and treat data preparation as part of the product delivery process.
Managing costs, ROI, and value realization
In most big data projects, costs don’t spike instantly, since they accumulate slowly across infrastructure, storage, compute, and tooling. For example, temporary data stores are left running, pipelines are duplicated for testing, or redundant datasets are copied across environments without governance. Over time, these practices inflate cloud bills while business outcomes remain unchanged.
The root cause is the lack of clear tracking: teams often don’t measure whether additional resources lead to better insights or improved performance. Without this visibility, projects consume budget and don’t deliver any return, which makes it difficult to justify further investment.
To regain control over costs and outcomes, connect technical costs to business goals. For every use case, measure what it delivers and what it consumes, for example, cost per report, per model run, or per decision supported. When those costs grow faster than the value they create, pause and review. The review means you need to check what drives the imbalance: the pipeline processes redundant data, the model runs too frequently, or business teams no longer use the outputs. By identifying where money is spent without clear return, you can either redesign the workflow to make it efficient again or retire it entirely. This way, your big data strategy will deliver value from data, rather than accumulate unnecessary volume.
Culture, change, and organizational friction
Here’s another hidden challenge: even if your technical stack is working, you might still struggle because people are used to old flows. Silos of decision-making, lack of data literacy, fear of metrics, or ownership ambiguity derail more projects than many tech failures.
Thus, data culture takes time. If you’re a C-level or IT manager, set expectations: data insights will change workflows, job descriptions will evolve, and every decision-maker has to own a metric. If you don’t lead that change, the technology won’t matter.
Regulatory and privacy complexity
This pitfall arises because requirements evolve (e.g., GDPR, CCPA, sector-specific rules, cross-border controls), while data often remains fragmented across systems. That creates real problems, such as duplicated records, inconsistent schemas, and broken audit trails, which make it difficult to prove a legal basis, apply retention policies, or respond to subject access requests. To stay compliant, companies must treat governance as an infrastructure, establish precise data classification, enforce field-level encryption and access control, and maintain full auditability across all systems.
Successful big data use cases in the real world
- Amazon uses item-to-item collaborative filtering and large-scale ML to personalize recommendations and stock products closer to customers. This allows the company to position inventory closer to customers, which shortens delivery times and reduces logistics costs. It’s a strong example of how a mature big data strategy directly translates into operational efficiency and revenue lift.
- More than 80% of viewing on Netflix comes from personalized recommendations based on user behavior, such as watch time and interactions. This helps reduce content overload, increases engagement, and lowers churn. This example shows how analytics embedded into the product experience can drive long-term customer retention.
- Microsoft Fabric’s healthcare data solutions unify structured and unstructured data (e.g., EHR, imaging) in a single analytics-ready environment aligned with standards like FHIR/DICOM, enabling analytics and AI at scale. This enables hospitals and research organizations to run large-scale analytics and apply AI models without manual data consolidation. Thus, integrated architecture solves one of the biggest barriers in healthcare: fragmented data.
- Uber Eats uses ML models to predict food-prep and delivery times and to synchronize courier arrival with when orders are ready, improving dispatch and matching decisions. Low-latency ETA models (e.g., DeepETA) support these real-time predictions.
- McDonald’s uses Dynamic Yield’s technology to personalize drive-thru menus based on real-time context like time of day or weather, improving upsell and customer experience. This dynamic adaptation improves upsell performance and enhances customer experience. It shows how real-time analytics can improve traditional, physical-service environments apart from digital products.
Conclusion
A successful big data strategy integrates six core elements: clear business objectives, robust governance, scalable architecture, an integrated tech stack, applied analytics, and organizational readiness. It begins with assessing your current data landscape and defining measurable goals, then continues through tool selection, policy enforcement, and advanced analytics implementation. But continuous monitoring, cost tracking, and data pipeline audits are essential to sustain value over time.
Companies that implement a strategy correctly can tackle common technical challenges of big data, like silos, data trust issues, increasing costs by linking usage to outcomes, and ensuring that compliance is embedded into operations. If your next step is to make data work for your business, learn more about SoftTeco’s big data services or contact us to assess your current data landscape and define the next improvement cycle.


Comments