Data is fueling the development and growth of any business, so it’s critical to deploy the right Business Intelligence tool to make the most of it. While there is an impressive variety of options in the market, the two most popular ones are Power BI and Tableau. Both have a rich set of features for user-friendly data visualization and both are used by big brands, such as JPMorgan Chase Bank, Amazon, Walmart, and many others.
When comparing Power BI vs Tableau, how do you choose a tool that is perfect for your specific business needs? This article aims to clarify the main similarities and differences between the two and explains the strengths and weaknesses of each.
Why Business Intelligence is critical for any modern business
To understand why the choice between Tableau vs Power BI is so important, it is essential to know what exactly is Business Intelligence and what benefits it brings. Business Intelligence (BI for short) can be defined as a process of analyzing the data and transforming it into actionable insights to help executives and managers to make data-driven and strategic decisions. With the help of these decisions, organizations are able to increase revenue, improve overall efficiency, and become more competitive since they use the data to:
- Make accurate assumptions and forecasts;
- Identify the company’s weaknesses and areas for improvement;
- Analyze and understand customers’ behavior and needs;
- Allocate resources and finances in a wiser manner.
A Business Intelligence tool is specialized software used to collect and analyze information and present it to users in a clear and concise manner via various data visualization formats. And though all BI tools share the same purpose, they also differ a lot. Hence, it is important to know about these differences so you can select a tool that will be a perfect fit for your business.
What is Power BI?
Power BI is a BI platform by Microsoft and, as Microsoft defines, “it is a set of services, apps, and connectors that work in conjunction to turn your data into valuable insights”. Released in 2015, the platform quickly became popular and has been viewed as the biggest Tableau competitor ever since.
In a simplistic scenario Power BI can be used as a no-code platform with drag-and-drop functionality. That means, you don’t need to have any preliminary tech expertise to visualize your data. Power BI is highly user-centric and intuitive, which is one of the main reasons why users love it. Also, Power BI connects to numerous data sources, thus expanding your data pool and providing more valuable insights. And obviously, since Power BI was produced by Microsoft, it is part of its ecosystem and works like a charm with other Microsoft products like Excel.
Main features of Power BI
While the functionality of Power BI is similar to the one of Tableau and other BI platforms, there are several distinctive features that set this solution apart from competition. Also, it’s worth mentioning the biggest Power BI features that bring companies the most value:
- Dataset filtering: by using Power Query, users can easily filter their data at various levels, such as page filters, report filters, etc.
- Auto-refresh: with Power BI, you can use both auto- and manual refresh options to regularly update your reports and work with real-time data.
- DAX functions: with the help of DAX (Data Analysis Expressions) functions, you can enhance the data analytics and perform a variety of actions with your data.
- Q&A tool: powered by AI technology, the Q&A smart tool enables users to ask questions in natural language and receive data-based answers.
- Data visualization: being a BI tool, Power BI by default comes with a variety of data visualization options.
- Collaboration: Power BI makes data and reports accessible for multiple users and enables easy collaboration and sharing, which is essential for an organization.
- Data transformation: if you worry that the collected data may not be suitable for analysis, we have good news. Power BI has tools that clean the data and prepare it for further analysis, so all data-related processes happen in one place.
There are obviously many more features but the ones above are the most interesting to know about. Now, onto the Power BI products.
Power BI products
It is essential for modern businesses to be able to access their data and reports from anywhere and anytime. Hence, Power BI offers several products that run on different platforms and vary in functionality, adding extra value to the platform:
- Power BI Desktop: a free tool for standard data visualization and reporting; the feature set is rather limited.
- Power BI Service: a cloud-based tool for publishing and sharing your reports and dashboards. Comes in three licensing plans: Free, Pro, and Premium.
- Power BI Pro: similar to Power BI desktop, but is cloud-based and has a richer feature set.
- Power BI Mobile: a mobile app that lets you access your reports and dashboards from the mobile device of choice.
- Power BI Report Server: an on-premises reporting server that is available only in Power BI Premium and SQL Server Enterprise Edition plans.
Power BI pros and cons
Though Power BI is loved by many and is considered one of the best BI tools out there, it has certain limitations and challenges that you should know about. In this way, you will ensure that this tool is a truly good fit for your business, and you won’t encounter any unexpected issues while working with it.
Power BI pros:
- Integration with the Microsoft ecosystem: being a Microsoft product itself, Power BI integrates seamlessly with Excel, SharePoint, and other Microsoft products that you might use.
- Great UX: despite its rich functionality and seeming complexity, Power BI is actually very user-friendly and is great for both beginners and advanced researchers. The navigation of the platform is quite intuitive and doesn’t require any tech knowledge.
- Cost-effective: unlike many alternatives, Power BI is rather affordable and comes in different pricing plans, thus being suitable for businesses of various sizes.
- Powerful features: Power BI boasts a ton of great features, including AI-based Q&A, Power Query, and auto-refresh.
Power BI cons:
- Potential performance issues: while Power BI is really fast and effective with small datasets, it doesn’t work so well with massive datasets and has a limit of 100 TB of data.
- Vendor lock-in: belonging to the Microsoft family is both an advantage and a disadvantage here because the Power BI performance may be limited on other platforms. For example, the desktop version of the platform would not work on macOS.
- Limited customization: Power BI does not allow you to play around with reports and dashboards configuration and is overall not too flexible in terms of tweaking.
- Limited functionality and data connectivity: despite being highly effective and feature-rich, Power BI connects to fewer data sources than Tableau and has a limited set of out-of-box features.
What is Tableau?
Tableau is a BI tool that was first introduced back in 2003, and in 2019 it was acquired by Salesforce. As you can guess, it now belongs to the Salesforce family and thus integrates seamlessly with Salesforce products.
Despite being relatively old, Tableau remains one of the top choices when it comes to Business Intelligence tools. It has an impressively vast functionality, works great with both small and large datasets, and connects to a huge variety of data sources. Add to that a big community, and you’ll understand why so many businesses still prefer working with Tableau than with alternative solutions.
Main features of Tableau
So, what sets Tableau apart from similar solutions, including the above mentioned Power BI? Let’s take a look at its most notable features:
- Vector-maps: for smooth work with map exploration and with the geospatial data, Tableau offers vector-based maps.
- Data highlighter: when you work with massive amounts of data and need to investigate specific data fields or groups in more detail, you can use the data highlighter tool to highlight them.
- Custom territories: in addition to built-in territories like countries or geographic regions, Tableau also allows you to create your own custom territories, which is highly valuable in certain use cases.
- Customization: Tableau is generally very customizable, and thus, it can be named one of its biggest and most attractive features. Tableau allows pinpointing the configuration of dashboards and reports and adjusting it precisely as needed.
- Data blending: not only does Tableau connect to multiple data sources, it also allows blending the data from different sources into a single report.
- Dashboard commenting: Tableau offers the dashboard commenting feature for enhanced and simplified collaboration. This feature allows users to leave comments and reply to them.
And obviously, Tableau comes with a set of essential data visualization and reporting tools, similar to the ones in Power BI. These tools include data modeling, data preparation, data exploration, and many others. Also, same as Power BI, Tableau comes in a variety of products, each suited for different purposes.
Tableau products
While the products mentioned below are very similar to Power BI ones, it is still important to discuss them in order to understand the extensive capabilities of Tableau and how well this platform may meet your needs.
- Tableau Desktop: being the main Tableau product, this desktop app is used for data visualization, has a user-friendly drag and drop interface, and can connect to a big variety of data sources.
- Tableau Server: a centralized and secure platform for storing and managing Tableau content within an enterprise.
- Tableau Prep: a useful tool for preparing and cleaning the data before it can be analyzed. With the help of Tableau Prep, you can create a consistent and clear dataset with raw data from multiple sources.
- Tableau Public: a free platform for public sharing of data reports and visualizations with the global community.
- Tableau Online: a cloud-based platform for securely sharing data over the Internet. Can be named a Tableau Server alternative and is used to share reports within an organization.
- Tableau Mobile: this mobile application grants access to your Tableau reports and dashboards from your mobile device.
Tableau pros and cons
Tableau is loved by many organizations and is still considered one of the most powerful and effective data visualization tools. However, due to its age and relative complexity, it also may pose certain challenges if not handled in advance.
Tableau pros:
- Great performance: unlike Power BI, Tableau seamlessly handles massive data sets and swiftly processes small ones.
- High level of customization and great flexibility: if you need to fine-tune a specific data report or set unique configurations, Tableau lets you do so. In this way, you receive unique visualizations and reports that are precisely aligned with your business goals.
- Integration with Salesforce: since many modern businesses use Salesforce, seamless integration of Tableau with this ecosystem eliminates a number of issues and allows you to get started instantly with your data.
- No OS limitations: Tableau works great on both macOS and Windows platforms and can be downloaded as a mobile app. Needless to say, such versatility is a huge advantage.
Tableau cons:
- Steep learning curve: due to Tableau’s complexity, it might be challenging for beginners and new users to onboard and learn the platform’s navigation and functionality. It is not as intuitive as Power BI and you’ll need some time to figure your way around it.
- Limited number of default visuals: there are only 24 default visuals in Tableau and if you need more advanced ones, you’ll need to buy them.
- Cost: Tableau is generally more expensive than Power BI so this might be among the decisive factors when choosing between the two.
- No auto-refresh feature: unlike Power BI, Tableau doesn’t offer automatic refreshing of the data, which may lead to inaccurate or irrelevant results.
- Lack of versioning and change management: one more significant disadvantage of Tableau is that the platform does not have version control or change management, which may often be inconvenient if you want to go back in reporting and track certain changes.
Key similarities between Power BI vs Tableau
To make a well-thought choice between Power BI and Tableau, it is important to understand both its similarities and differences. First, let’s look at the key areas where these two platforms overlap.
Popularity
While some may say that popularity is not valid enough to be considered a decisive factor upon the platform choice, we disagree and here is why. The popularity of a software tool usually impacts the size of its community, availability of documentation, and support for this tool. Hence, the more popular a tool is, the easier it will be to work with it since there is most probably a big community behind it, ready to help.
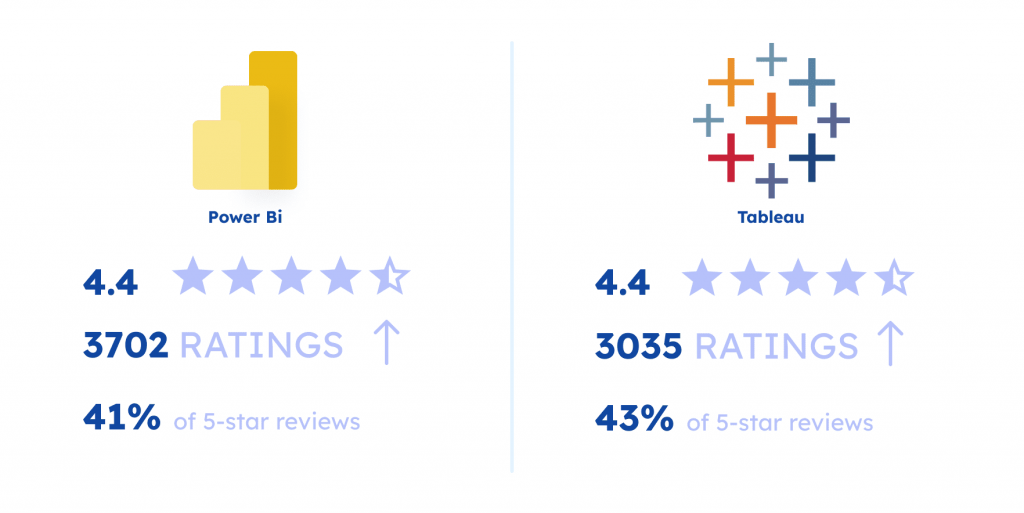
According to a report by Gartner, Tableau and Power BI share the first and second place in the list of the BI products with the following numbers:
Tableau:
- 4.4 stars
- 3702 ratings
- 41% of 5-star reviews
Power BI
- 4.4 stars
- 3035 ratings
- 43% of 5-star reviews
Both platforms share a great number of users (companies that deploy these tools) and are loved by both big brands and small/medium-sized companies.
Rich visualization options
Any good Business Intelligence tool should offer a plethora of visualization options and formats, and Power BI and Tableau successfully meet this requirement. Let’s discuss them both in a bit of detail.
As already mentioned, Tableau is highly customizable and offers a rich array of visualization formats. The majority of reports in Tableau are created from scratch, which is both good and bad. Good because you can fine-tune them exactly as needed, but bad because it takes more time and sometimes requires a bit of expertise and knowledge.
Power BI has more pre-built templates and is easier to use while also offering lots of visualization formats. For example, it has the same hierarchical drill-down and mapping features as Tableau, though they are not as customizable.
High usability
Usability is an important feature of an effective BI tool, since that’s the whole point of data visualization: to present insights and information in a user-friendly way.
Both Tableau and Power BI are highly user-centric, though Power BI is more intuitive and less complex. With Power BI, you can start working right away and the creation of reports and dashboards does not take too much time. Tableau, on the other hand, is suitable for more experienced researchers and analysts and the creation of reports and the overall user interface may seem a bit too complex.
Variety of data sources
The more data sources you use, the more accurate and detailed the reports will be. Hence, it’s critical that your BI tool connects to various sources and blends the data effectively. Here are a few examples of sources that both Tableau and Power BI connect to:
- Amazon Redshift
- Excel
- Google Analytics
- BigQuery
- Hadoop
- MySQL
- IBM DB2
- Oracle
- PostgreSQL
And many others. Note, though, that since these two tools belong to different ecosystems, their usability and connectivity will vary. So make a choice depending on the tools that you use within your organization. If you primarily use Microsoft, the choice will obviously be Power BI, while Salesforce adepts will find Tableau more convenient. Also, research native data connectors for each solution and see which ones you are planning to use.
Key differences between Tableau vs Power BI
Though these two BI tools are quite similar, there are also a few big differences that often help businesses make the final choice between Power BI versus Tableau. Thus, let’s answer the “what is the difference between Power BI and Tableau” question below.
Pricing
The first and most important difference between Tableau and Power BI is probably the pricing of the platforms. We’ve already mentioned that Power BI cost vs Tableau is much more affordable – now, let’s look at each tool separately and in detail.
We’ll start with Power BI.
The great news is that Power BI has a free version, which is Power BI Desktop. It is intended for home users and allows you to create visualizations and build dashboards on your desktop device. However, you can’t share your reports, which is a drawback.
Next, there are the following premium plans:
- Power BI Pro: $10/month per user. Allows building reports and sharing them across your organization.
- Power BI Premium: $20/month per user. Offers more advanced analytics tools and simplified data management, together with all the same features of the Pro plan.
- Power BI Premium per capacity: $4995 – $6890 per capacity/month. Has the same functionality as the regular Premium plan but does not limit the number of users, which can be highly valuable for big organizations.
Here is a quick table to summarize all Power BI pricing plans:
| Name of the plan | Cost | Description |
|---|---|---|
| Power BI Desktop | Free | For individual users and home use. Allows creating reports and dashboards but does not allow sharing them. |
| Power BI Pro | $10/month per 1 user | For users within an organization. Allows creating reports and dashboards and allows sharing them. |
| Power BI Premium | $20/month per 1 user | Same as Power BI Pro but with more advanced and powerful features and easier data management. |
| Power BI Premium per capacity | $4995 – $6890 per capacity/month | Same as Power BI Pro, but allows an unlimited number of users within an organization. |
Now, to the Tableau pricing. Spoilers: it’s way more expensive.
The only free product that Tableau offers is Tableau Public – a free platform for data visualization. It can be described as a learning tool as it allows creating data visualizations and dashboards and sharing them with the public community, thus helping users improve their data management skills. However, it is not suitable for businesses and employees, so let’s keep going. Here are the paid plans:
- Tableau Creator: $70/month per user. Provides good functionality for report creation and sharing, and grants access to Tableau Desktop and Tableau Prep Builder products. Also includes one Creator license for Tableau Cloud or Tableau Server.
- Tableau Explorer: $40/month per user. You can explore and interact with the reports created by others but cannot create reports yourself. This plan includes a Tableau Cloud explorer license.
- Tableau Viewer: $15/month per user. This plan allows only viewing reports but without any interaction. Also includes a Tableau Cloud view license.
| Name of the plan | Cost | Description |
|---|---|---|
| Tableau Public | Free | More of a learning tool to shape your data analytics skills and to create visualizations and reports for the personal use |
| Tableau Creator | $70/month per user | Enables users to create and share reports. |
| Tableau Explorer | $40/month per user | Allows only exploration of reports and interaction with them (i.e., commenting) but does not allow creation of reports. |
| Tableau Viewer | $15/month per user | Allows only viewing reports that are created by others. |
User interface
Though we’ve listed usability as one of the biggest strengths of both platforms, their user interfaces differ a bit, and it’s worth noting that.

Judging by the ease of use, Power BI is a clear winner. It has a very clear and intuitive interface with a variety of features to convert your raw data into meaningful insights. The dashboards are simple to understand and overall, the navigation through Power BI is very intuitive. In this way, you don’t need to have any prior experience with BI tools to work with Power BI.
The story is a bit different for Tableau. While it’s relatively easy to use, its interface is more cluttered and complex than the one of Power BI. First, many of its features are hidden behind menus, so you need to know what you are looking for. Second, since you create reports and visualizations from scratch, you’ll have to go through more steps, and some of them can be quite confusing. Overall, Tableau seems more cluttered than Power BI and definitely requires you to have previous experience with BI tools.
Performance
While both tools display a high level of performance, it differs when it comes to data sets of various sizes. Both Tableau and Power BI perform great with small data sets, and Power BI may even be more efficient. However, Power BI may slow down when processing massive data sets, while Tableau handles them perfectly. Hence, when choosing between the two, consider what type of datasets you deal with more frequently.
Power BI vs Tableau: a comparison table
Let’s draw the bottom line with a Power BI vs Tableau comparison matrix and recap the biggest features of both.
| Power BI | Tableau | |
|---|---|---|
| Release year | 2013 | 2003 |
| Owned by | Microsoft | Salesforce |
| Programming language | DAX | MDX |
| Supported languages | R and Python | R and Python |
| Pricing | – Power BI Desktop: free, for home users only. – Power BI Pro: $10/month per user, allows creating and sharing reports. – Power BI Premium: $20/month per user, has more advanced analytics tools and better data management. – Power BI Premium per capacity: $4995 – $6890 per capacity/month, supports an unlimited number of users. | – Tableau Public: a free “learning” platform to master data visualization skills. – Tableau Creator: $70/month per user, allows creating and sharing reports. – Tableau Explorer: $40/month per user, allows only exploring and interacting with reports, without creating them. – Tableau Viewer: $15/month per user, allows only viewing reports. |
| Performance | Good but may have issues when processing massive data sets | Highly effective in working with both small and big data sets |
| Usability | High. The user interface and available visualization options are very user-friendly and intuitive. | Good but can be a bit too complex for inexperienced users. |
| Data visualizations | Rich. Provides a big variety of visualization formats. | Very rich, offers advanced visualization formats. |
| Customization | Medium | High |
| Deployment type | On-premises and Cloud | On-premises and Cloud |
| Security | Row-level security | Row-level security |
| Learning curve | Low. Does not require preliminary experience, has an intuitive drag-and-drop interface. | High. Though also being a no-code platform with a drag-and-drop interface, Tableau is not suitable for new users and beginners. |
| SQL Support | Yes | Yes |
Final word
When discussing Power BI vs Tableau, it can be hard to decide which is better for your organization. Both tools are very powerful and popular. Some businesses claim that Tableau is the best thing that happened to them, while others migrate from Tableau to Power BI and are immensely happy with the decision. So how do you make the right choice and which is better, Tableau or Power BI?
We recommend evaluating your current digital ecosystems and software tools that you most often use and assessing Tableau vs Power BI pros and cons. See how well these tools can be integrated with either Tableau or Power BI, and whether there are any specific features that you are looking for in a BI tool. Also, don’t hesitate to reach out to SoftTeco – our data scientists will gladly help you with the comparison of Tableau and Power BI and their evaluation.

Comments