When it comes to logs analysis and metric visualization, Kibana and Grafana stand out as two prominent platforms, each offering powerful capabilities for companies of all sizes and needs. They help explore, analyze and visualize data in various ways and create customized and intuitive dashboards with all necessary integrations. Due to this, companies get the most out of their data by monitoring system performance, detecting anomalies, and troubleshooting upcoming issues quickly and efficiently.
While the two platforms share a lot in common, they also have some differences. In this article, we delve into an in-depth comparison of Kibana vs. Grafana, and explore their strengths, weaknesses, and use cases to determine which is a better solution for your company.
What is Kibana?
Kibana is an open-source data visualization and analysis platform. It is part of the ELK stack consisting of three tools that work together: Elasticsearch, Logstash, and Kibana. Kibana enables users to dynamically explore, visualize, and analyze vast amounts of log data collected by Logstash and stored in Elasticsearch. Users can perform advanced data analysis, create custom visualizations, and share insights with others easily via Kibana.
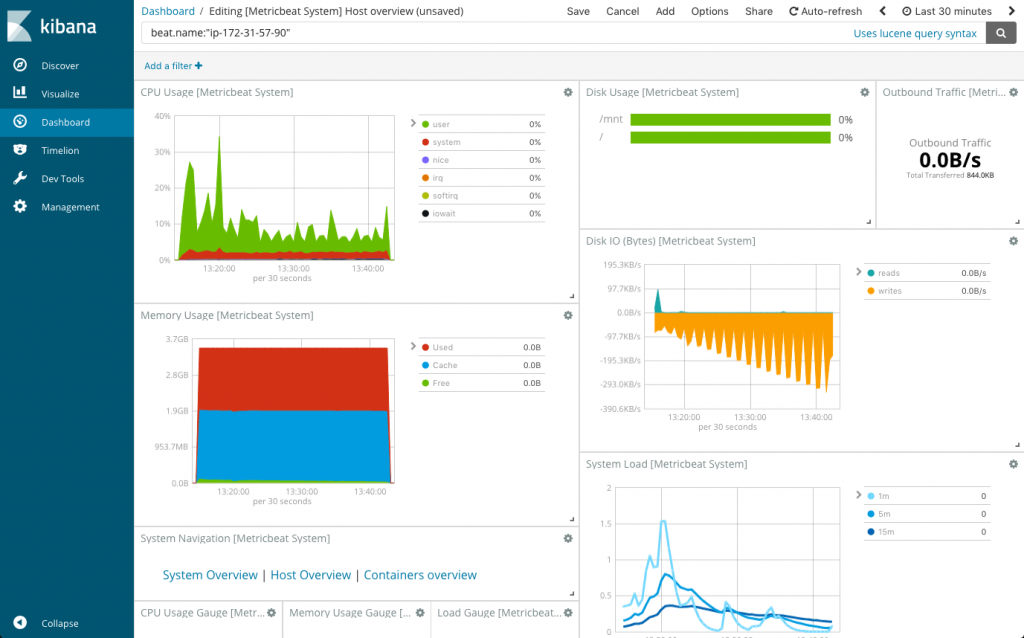
One of the main features of Kibana is its ability to display log data in various visual formats, including charts, tables, maps, and graphs. This makes it a powerful tool for monitoring system performance, troubleshooting issues, and identifying root causes. Initially developed in 2013, Kibana evolved to be the frontend interface for log management, but now its capabilities go beyond log visualization:
Here are some of the main features of Kibana:
- Visualization: users can visualize information in different formats, such as vertical bar charts, horizontal bar charts, pie charts, line graphs, etc.;
- Dashboards: users can create dynamic, adaptable, and customized dashboards and share them with other team members;
- Geospatial data: Kibana provides support for geospatial data and allows users to visualize their information on maps;
- Data export: Kibana allows users to export their visualizations and dashboards in various formats such as PDF, PNG, CSV, and more;
- Plugins: allows users to install plugins to add custom visualizations and other enhancements, for example, plugins for 3D charts;
- Search and query capabilities: allows users to retrieve, filter, and aggregate data stored in Elasticsearch efficiently with intuitive free-text and field-based searches and KQL as its default query language;
- Analysis and data exploration: this feature enables ad-hoc analysis and the creation of custom views to gain deeper insights into the data to uncover trends, patterns, and anomalies.
Overall, Kibana is a versatile tool for various use cases. It provides a user-friendly interface for log and event data analysis and monitoring in domains such as IT infrastructure, security analytics, business intelligence, and more. Organizations can benefit from its flexibility, scalability, and extensive range of features, which are often compared with its main competitor – Grafana.
What is Grafana?
Grafana is also an open-source observability platform that allows users to visualize metrics, logs, and traces from diverse systems, regardless of their storage location. Unlike Kibana, which primarily focuses on log and event data analysis within the ELK stack, Grafana sets its sights on enhancing monitoring metrics. It particularly supports time-series data visualization from various data sources such as InfluxDB, OpenTSDB, and Prometheus. Created in 2014, Grafana quickly became known for its broad data source support and powerful time series data visualization capabilities.
Moreover, Grafana offers Grafana Enterprise package for large companies with complex data visualization requirements, providing customer service and training from its development team. One of Grafana’s key strengths is its extensibility and flexibility. It offers a vibrant ecosystem of plugins and integrations, allowing users to customize and extend its functionality according to their unique needs.
The key features of Grafana include:
- Visualization panels: it provides a variety of visualization options, such as bar charts, heat maps, histograms, and more, enabling users to monitor systems in teal-time and detect anomalies;
- Custom plugins: users can install community built-in plugins or create custom ones to extend Grafana and integrate it with other needed solutions to add new features and data sources;
- Dashboard templating: templating lets users create dashboards that can be shared among teams and reused for different purposes;
- Alert manager: allows users to set up alert rules based on thresholds, conditions, or patterns in their data, ensuring timely response to critical events via email, Slack, or other notification channels;
- SQL data sources: Grafana allows users to turn anything in an SQL database into metric data that you can graph;
- Provisioning: this feature allows users to automate the creation of dashboards, data sources, and alert rules;
- Security: it provides robust security features, including role-based access control (RBAC), LDAP integration, and SSL/TLS encryption, keeping information secure and only allowing certain employees to access dashboards.
Overall, Grafana lets users monitor and analyze metrics, gain insights into systems and applications, and detect anomalies with attractive and user-friendly interfaces that are easy to navigate.
The comparison: Kibana vs. Grafana
After examining the capabilities of both platforms, let’s delve into an in-depth comparison of the differences and similarities between Kibana and Grafana.
Logs vs. Metrics
The main difference between Kibana and Grafana lies in their purpose. Kibana is primarily designed to explore, analyze, and visualize log data stored in Elasticsearch. This makes it well-suited for logging use cases, where users need to analyze and visualize log data to gain insights into system behavior, app performance, and more. For this purpose, Kibana provides powerful search and query capabilities, interactive dashboards, and advanced analytical features.
On the other hand, Grafana is focused on metric monitoring (such as system CPU, memory, and disk) and visualization. It is used for monitoring purposes, where users need to track and visualize real-time metrics and performance indicators to ensure system security, identify trends, and detect anomalies. It supports the visualization of time-series data, alerting, and integration with a wide range of data sources, like Prometheus and InfluxDB, allowing businesses to monitor various systems and apps.
Thus, when it comes to logs, Kibana stands out as the go-to choice for problem-solving, development, and security tasks, regardless of the specific use case.
The winner: Kibana
Setup, installation and configuration
It is easy to install and set up both Kibana and Grafana. They support installation on Linux, Mac, Windows, and Docker and can be deployed on-premises or in the cloud.
Kibana supports different installation options per operating system. From the official website, users can download the package and extract it. But Kibana’s setup process may require additional configuration steps. They may include customizing settings in the kibana.yml configuration file and adjusting other settings based on user preferences. While Kibana’s configuration file offers extensive customization options, users need to be mindful of syntax and formatting requirements when editing YAML files.
Grafana’s installation process is quite simple. Users can download or install the suitable package for their operating system via package managers. Once downloaded, installation typically involves extracting the package and starting the Grafana server. Users can configure data sources, create dashboards, and set up alerts via the Grafana UI or configuration files. Grafana dashboards can be configured using a .ini configuration file, which is easier than configuring Kibana.
Both tools are relatively easy to install and set up. Still, Grafana may have a slight edge in ease of configuration due to its user-friendly web interface and simpler syntax for configuration files.
The winner: Grafana
Data source integration
As Kibana is part of the Elastic/ELK stack, it is designed to work with Elasticsearch. Thus, Kibana does not support other data sources. But keep in mind that Elasticsearch is compatible with many different platforms. So, if you want to use Kibana to combine data from other sources, you need to import it into the ELK stack (via Filebeat or Metricbeat, then Logstash, then Elasticsearch).
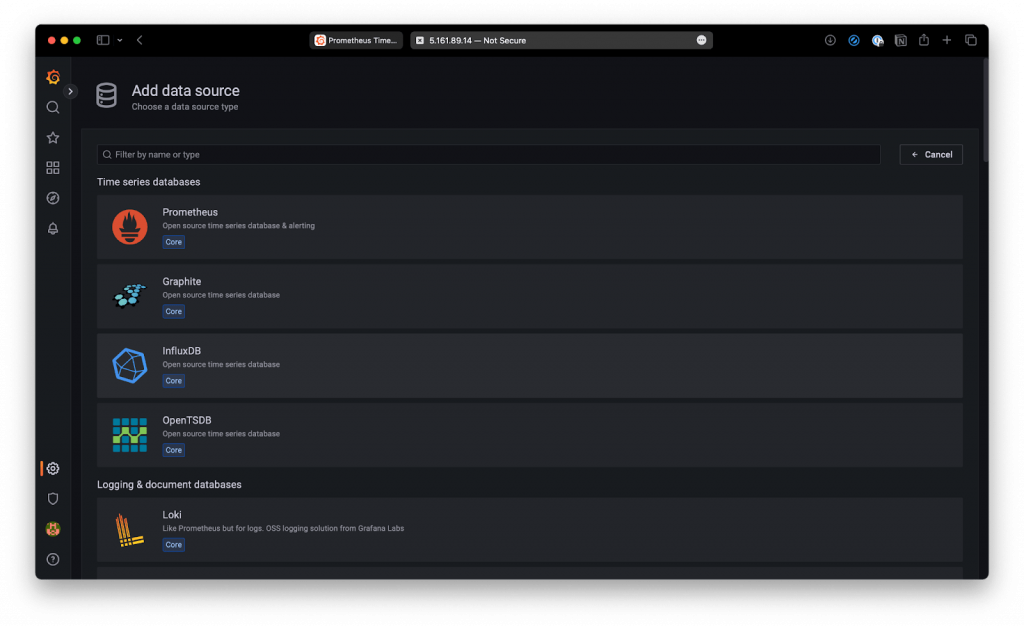
Grafana can boast extensive support for various data sources beyond Elasticsearch, including Prometheus, InfluxDB, Graphite, MySQL, SQL, and more. By connecting to multiple data sources simultaneously, users can create unified dashboards that include data from various sources. Grafana has a specific query editor for each data source based on its features and capabilities.
The winner: Grafana
Access control and authentication
The Elastic Stack, which includes Kibana, provides built-in security features even with its basic (free) license. These features include role-based access control (RBAC) and various authentication mechanisms, including basic, token, and API key authentication. By using them, organizations can control data access, prevent unauthorized access, and ensure compliance with security standards without the need to invest in additional third-party solutions.
On the other hand, Grafana also offers built-in security features. It allows users to restrict and control access to their dashboards, including role-based access control (RBAC), lightweight Directory Access Protocol (LDAP), or an external SQL server. Organizations allow users to create groups and teams for different projects. Every member of an organization can access their organization’s dashboards through a specific role with various permissions. Users can also set up unique API keys and assign them to particular roles.
The winner: Both
Querying
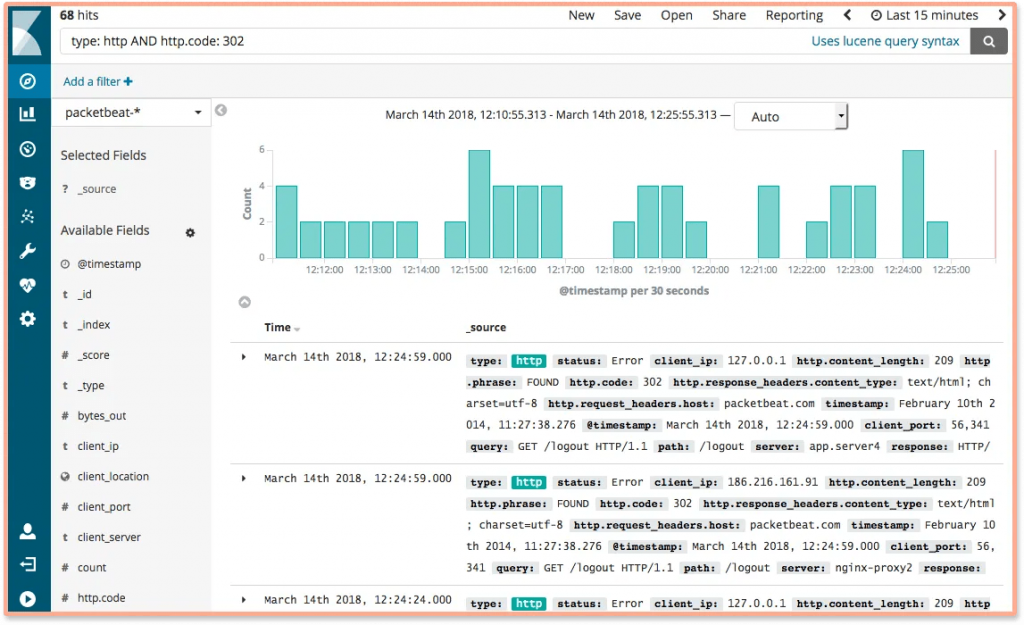
One of the best features of Kibana is querying and searching logs. Users have various querying methods, including Lucene syntax, Kuery, and Elasticsearch Query DSL (Domain-Specific) languages. With them, data stored in Elasticsearch can be searched with results displayed in chronological order in the main log display area. They can be used to filter, aggregate, and analyze data in Elasticsearch using a rich set of query operators. Although they are powerful querying languages, learning them can be difficult. In addition, Elasticsearch Query DSL is only compatible with the ELK stack.
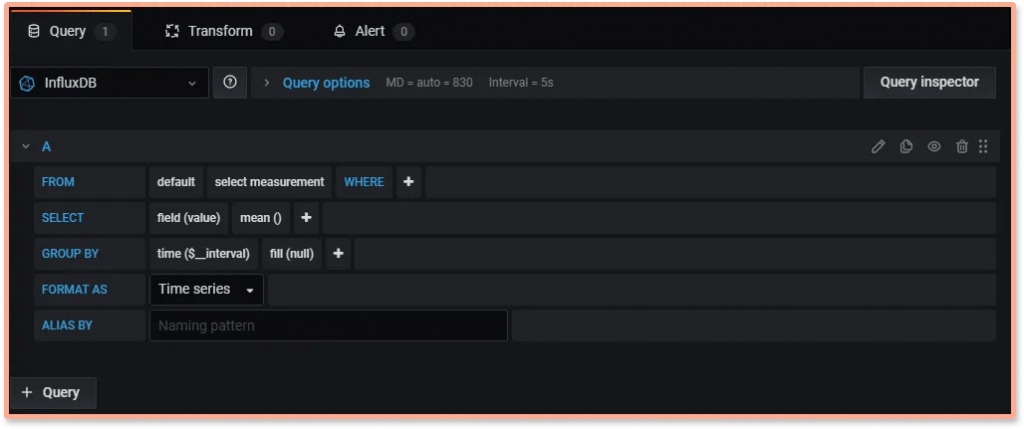
Due to Grafana’s time-series data analytics interface, it is best suited for monitoring changes over time. Compared to Kibana, it lacks optimized exploration of other kinds of data and fewer capabilities for querying and refining data. However, users can use Query Editors to perform data queries from various sources. All data sources have their own Query Editor, which means that syntax and features vary according to the data source.
The winner: Kibana
Visualization
Compared to Kibana vs. Grafana, both are powerful visualization platforms, but in terms of how dashboards are created, they differ.
Kibana offers a rich variety of visualization types, allowing users to build line graphs, pie charts, heat maps, and so on and combine all these into dashboards. Kibana dashboards are dynamic and versatile – it is simple to edit and open both full-page and edited dashboards. You can use these visualizations to identify trends and patterns and customize them to meet specific needs.
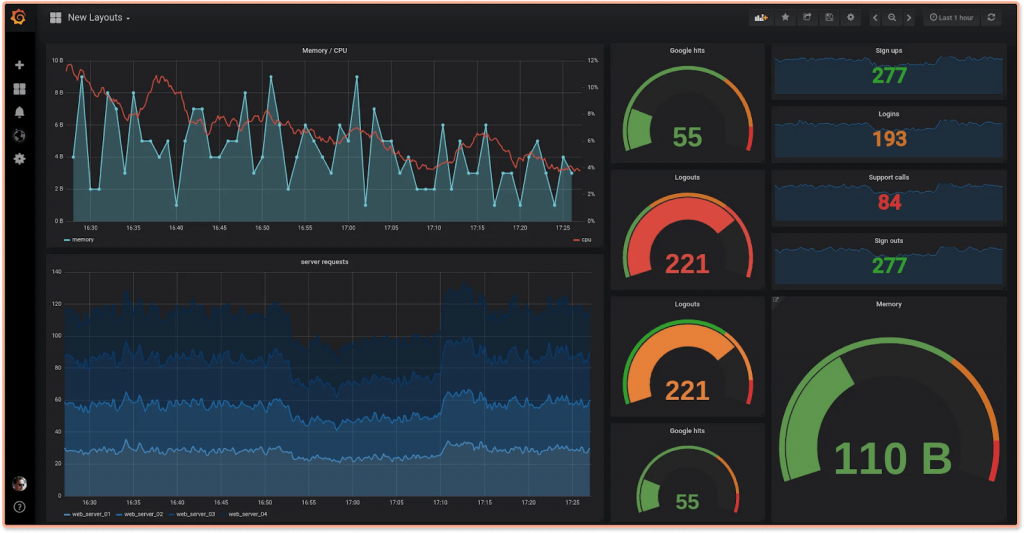
Dashboards make Grafana such a popular visualization tool due to its versatility. It offers beautiful and engaging graphs and dashboards and is more customizable and flexible than Kibana. Data visualizations are called panels; users can create dashboards containing panels from different data sources. Grafana supports graph, singlestat, table, heatmap and freetext panel types.
As a whole, Grafana has a wider selection of customization options and also makes changing the different settings easier with panel editors and collapsible rows.
The winner: both
Alerts
When comparing Kibana vs. Grafana regarding alerts, Grafana (version 4.0) has a built-in alerting mechanism that allows users to create conditional rules on dashboard panels that trigger alerts (email, Slack, or custom webhooks). Users can also create alerts based on information from multiple sources, including Elasticsearch, Graphite, and others. Users can create personalized alerts for any time series metric and configure them. Also, they can handle special cases, like data unavailability or failed connections.
In contrast, Kibana does not offer an out-of-the-box alerting capability. However, it allows users to use third-party plugins to add alerting functionality. To do this, users can either opt for a hosted ELK Stack such as Logz.io, implementing ElastAlert or X-Pack. Moreover, users can configure alerts in Elasticsearch via the API and Watcher function. A watcher runs a query periodically and performs a specific task based on the results. The watcher history allows users to track alert activity and troubleshoot problems.
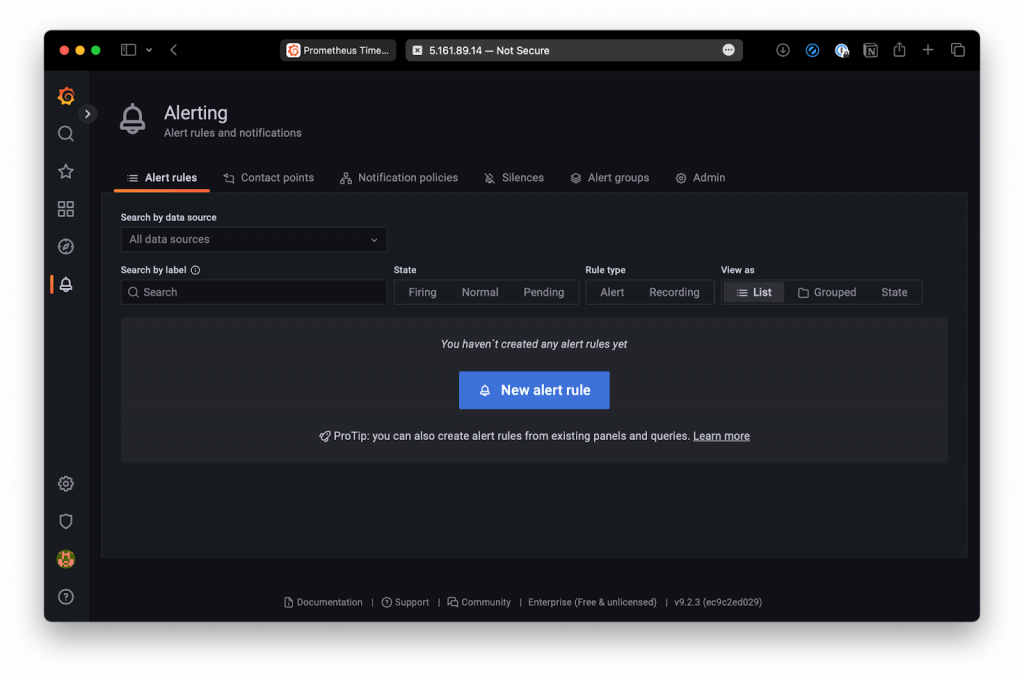
The winner: Grafana
Community
Considering Kibana vs. Grafana in terms of community, both platforms have a large and active developers around the globe. Kibana has 71178 commits, with 19.1k starts and around 800 contributors on GitHub in 2024. While Grafana has over 48283 commits, with 59k stars by over 2000 contributors on the same site. Both tools offer detailed and well-written documentation and are quite easy to navigate. Although both tools are highly active, Grafana has a slight advantage based on the frequency of commits.
The winner: Grafana
Pricing
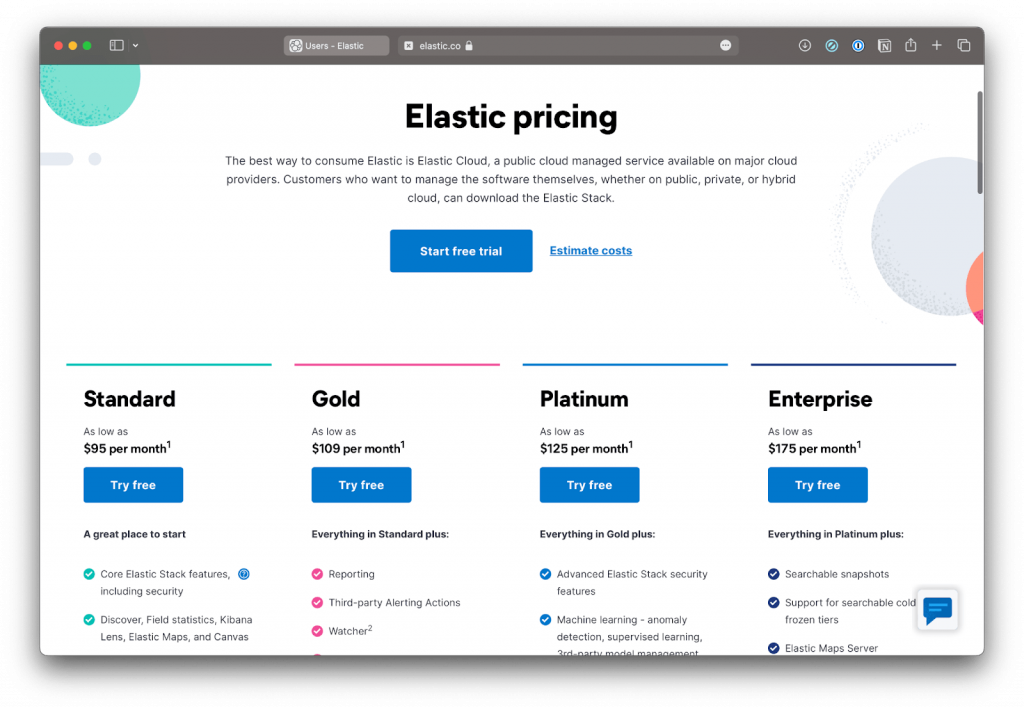
Lastly, let’s compare Kibana vs. Grafana in terms of prices. You can run both products on your own server because they offer self-hosting options.
As Kibana is part of the Elastic/ELK stack, and you are interested in using Kibana, you will need to purchase the entire stack. The Elastic stack has four pricing tiers, where the cheapest option starts at $95 monthly. You can learn more about Kibana pricing on their site.
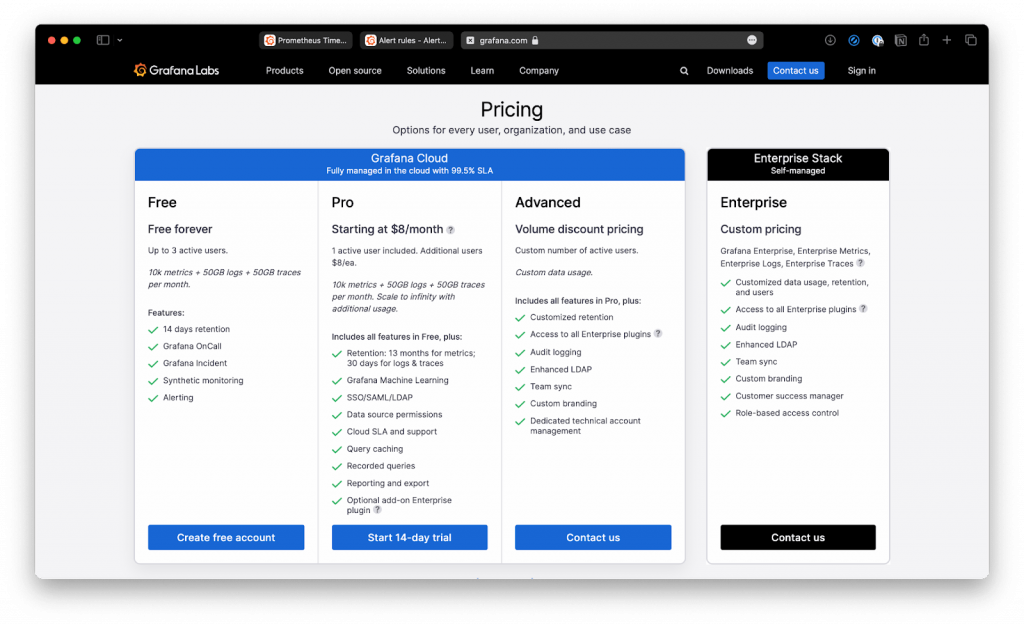
Grafana Labs also offers a Grafana Cloud product with three price tiers: Free, Pro, and Advanced. You can start for free and then pay for any usage beyond that. Thus, the Pro tier starts at $8 per month, which is an affordable option for small teams. The Advanced tier starts at $299 monthly and perfectly suits large enterprises. To find more information on what exactly these packages offer, visit the Grafana pricing page.
The winner: Grafana
A brief comparison: Kibana vs. Grafana
To put the main information Grafana vs. Kibana together and help you decide what is the most suitable solution for you, we’ve prepared the following table:
| Kibana | Grafana | |
|---|---|---|
| Usage | For log file analysis and full-text search queries | For apps requiring continuous real-time monitoring metrics |
| Data source integration | Primarily Elasticsearch | Supports multiple data sources |
| Syntax | It uses the Lucene syntax | It uses a Query Editor |
| Alerts | Supports but only with plugins | Supports data alerts in real-time for the priority metric |
| Visualization types | Line, bar, pie, area, heatmap, gauge, tag cloud, region map, tile map, markdown | Graph, singlestat, table, heatmap, free text |
| Plugin ecosystem | Limited plugins and integrations | Rich ecosystem with extensive plugins |
| Geospatial support | Built-in support for maps | Limited support |
| Time series-data | Limited support | Supports |
| Full-text queries | Supports | Does not support |
| Data querying and analysis | ✅ | ✅ |
| Cross-platform capabilities | ❌ | ✅ |
| Community support | ✅ | ✅ |
| Visualization features | ✅ | ✅ |
| Log analysis | ✅ | ❌ |
| Easy of use | ❌ | ✅ |
| Customization options | ✅ | ✅ |
Final Thoughts
Both Kibana and Grafana are powerful open-source platforms that help companies analyze, visualize and monitor vast amounts of information. But they have differences in their features that may lead you to prefer one over the other. Kibana is a preferred choice if you need to explore, visualize, and analyze log data in Elasticsearch, using a variety of visualization types, perform geospatial analysis, and combine multiple visualizations in interactive dashboards.
Grafana is your win-win solution for time-series data visualization and metric monitoring with various data sources integrated into unified dashboards. Grafana is often used to monitor servers and applications, unlike Kibana, which is used for ad hoc data analysis and exploration. So, the choice between Kibana vs. Grafana depends on the specific requirements of your project, priority features, and the type of data you are working with.
Expert Opinion
Choosing between Kibana and Grafana isn’t a one-size-fits-all solution. While both tools shine in data visualization, their strengths diverge. Kibana, tightly knit with Elasticsearch, excels at dissecting log data. In contrast, Grafana’s adaptability allows it to visualize metrics from diverse sources. Your decision should rely on factors like the nature of your data (logs or metrics?), your existing data infrastructure, and future needs, as both platforms constantly evolve. Don’t forget the total cost of ownership, which includes licensing, setup, and maintenance, to ensure your choice fits your budget and technical needs.

Comments