Data quality management is a set of practices, ensuring that the data driving your decisions is accurate, consistent, and trustworthy. When data quality slips, companies operate on blurred signals, and eventually you get slower growth, bad forecasts, and millions lost to preventable errors.

Gartner has warned that more than 40% of critical data in large enterprises is flawed (inaccurate, incomplete, or duplicated), which means the problem isn’t edge cases, but everyday operations. It’s like running a company with a dashboard where half the gauges are slightly off. Nothing is obviously broken, but speed, fuel, and direction never feel quite right. Teams still produce reports and dashboards, but forecasts drift, campaigns reach the wrong people, and operations end up fixing issues only after customers notice them.
In this article we explain how data quality management works in practice, what typically breaks first, and how to put controls in place that actually hold up at scale. For your teams, the payoff is simple, as they get fewer firefights, more reliable analytics, and decisions you can trust when they matter most.
What is data quality?
There is no uniform definition of data quality since it might differ for different companies. While company A deals with just one Excel sheet, company B would consider a huge database not enough. Obviously, these companies will be using different approaches to evaluating their data.
But since we need a definition, we can say that data quality is the match value of the data to the intended business use. In other words, it’s the level of correspondence of the data to the business tasks. If we cannot fulfill a task because of the data, it will indicate its poor quality and vice versa. For example, if your marketing campaign fails because the demographic data about the customers was incorrect, that means the data quality was insufficient.
In CRM, data quality problems show up fast because everything depends on the same records: lead scoring, opportunity stages, attribution, customer history, and reporting. When the CRM pulls data from marketing tools, billing, and ERP, even small mismatches in IDs, field logic, or update timing can break dashboards and forecasting. If you need to fix data at the source level, for example, deduplication, validation rules, field governance, stable pipelines between systems and so on, our data engineering services cover that work end to end.
Data quality dimensions
Business data has different shapes, sources, and formats, which means no single metric can define its quality. Organizations use several data quality dimensions to measure whether their data is reliable enough for decision-making.
Consistency
Data remains the same across all systems and databases. If a customer’s address differs between the CRM, billing system, and support tool, teams start arguing about which one is correct. Inconsistent data slows down operations and erodes trust because no one knows which number to believe. Over time, people stop relying on the data altogether.
Completeness
This dimension looks at whether required fields are actually filled in. It’s fine to miss optional fields, but missing an email, account ID, or shipment date is not. Gaps like this often come from broken forms, rushed data entry, or failed integrations. Left unchecked, incomplete data breaks reporting, automation, and downstream workflows.
Accuracy
Accuracy tells you, whether the data is actually correct. A name can be perfectly formatted and still be wrong, outdated, or misspelled. That’s how Inaccurate data leads to failed deliveries, rejected payments, and poor customer experiences. This is one of the hardest dimensions to fix because errors often look valid at first glance.
Orderliness
Data follows the required structure, format, and standards. For example, dates should follow the same pattern, names should use the same casing rules, and identifiers should look the way systems expect them to. When data ignores formatting standards, integrations fail and validation logic gets messy. Orderly data makes automation easier and reduces fragile, one-off fixes.
Uniqueness
This one checks whether one real-world entity appears only once in your systems. Duplicate customer or product records cause double emails, duplicate shipments, and skewed analytics. These issues often grow slowly and quietly, especially without master data management in place. Once duplicates spread, cleaning them up becomes expensive and risky.
Auditability
You can access the data anytime, and you can track down the changes made to the record. It means you can enter the database and see that the changes to a customer’s address have been made.
It is important to remember that every company will prioritize these attributes in an individual manner. A 100% score for each data attribute is more of a perfect than a real-life scenario. In reality, companies usually aim for something like 80% uniqueness, 90% consistency, 75% accuracy, etc. These thresholds are set in accordance with business goals and requirements, and they may be changed in the future.
The importance of data quality
We have already stated that the quality of the data impacts business decisions and the company’s growth. Here are a few more real-life benefits that highlight the importance of data quality.
Marketing purposes
The activity of any company revolves around its clients since they directly impact profitability. Therefore, it is crucial to adjust one’s marketing strategy to the customers, their behavior, and preferences.
If the data is incorrect or missing certain values, this might lead to critical errors, such as a wrong demographic portrait of the audience, irrelevant digital advertising, and similar issues. As a result, the company will lose both time and finances as well as customers’ loyalty by presenting them irrelevant offers based on incorrect data.
Inventory and supply chain management
Inventory and supply chain management are other critical aspects that demand careful and accurate management. In order to wisely balance the demand and the offer as well as other related processes, a company needs to have precise information on its inventory, customers’ demand, state of the goods, etc.
Financial reporting
Financial strategy is an essential part of managing a company. In order to grow, retain employees, and remain competitive, an entrepreneur must know all financial aspects of his company from cover to cover. Now, you can imagine the outcome if the financial data is presented incorrectly or misses certain values. Even the tiniest mistake in financial reports can lead to serious consequences in the future so it is important to keep all the information updated and regularly checked.
Data quality management process
A successful data quality management process outlines how an organization gathers, verifies, amends, and oversees its data across various systems. Forward-thinking companies view data quality as an ongoing journey, bolstered by strong governance, smart automation, and well-defined responsibilities. The following processes are essential to building a data quality framework.
Defining data quality rules
Before any profiling or cleansing can happen, organizations need to decide what “good data” actually means for their business.
We already stated that a 100% score for each data attribute is not a common case at all for the majority of companies. The reason for that is that it is incredibly cost- and time-consuming to achieve such a level of compliance, so companies usually identify the most important attributes and adjust their data quality management procedures correspondingly.
So, how do you set the data quality rules?
First, select a certain piece of data to set the rules for. Let’s take a customer’s full name as an example. If it is the most important information, you would want it to be as accurate as possible. Therefore, you can set a 90% quality threshold for the customer’s full name. Once you decide on the data to evaluate, you can choose the attributes to measure – let’s take accuracy and consistency. That means that the accuracy and consistency attributes for the customers’ full name should both meet the 90% quality threshold.
Once you have done that, you will need to set certain rules that will help evaluate the data. In case of a full name, they might be as follows:
- The full name should contain a space between the two words.
- Both words in the full name should start with the capital letter.
- The full name should not contain any numeric characters.
The rules should be set for every piece of data evaluated and the same goes for the quality thresholds.
Data profiling
Once the rules and the thresholds are set, you can assess your data and see whether it falls under the quality standard that you established.
This is where you need to perform data profiling, that is the first control check in managing data quality, providing your teams with a comprehensive insight into the data behavior, structure, content, and common errors. With profiling tools, you can calculate data quality metrics such as data completeness, data accuracy, data consistency, and data timeliness while spotting anomalies, duplicates, and skewed distributions. Profiling is widely used among organizations to evaluate customer data, financial data, healthcare data, and supply-chain data prior to these resources entering analytics, reporting, and operational systems.
Getting back to an example of a customer’s full name, we will measure the accuracy of this data with the help of the three rules, described above. And this is where things get interesting.
Once we measure the data, it might turn out that 95% of the full names contain a space between the two words, 70% of the data start with a capital letter, and 80% of the data contain only alphabetic characters and spaces. Each rule usually has a different business weight, and some rules act as hard blockers. For example, a missing space might be a minor issue, while non-letter characters in a name could break integrations or legal documents. In this case, even if most rules pass, a critical rule falling below the threshold means the data still fails the accuracy requirement. This weighted approach mirrors how data quality is assessed in real business systems and must be applied separately to each key data attribute.
Data cleansing
After completing the data profiling process, you will most probably find out that your data needs to be remediated or, in other words, cleansed. Cleansing is essential for master data management (MDM), operational reporting, and regulatory compliance. It reduces errors in CRM systems, improves customer data accuracy, and mitigates issues caused by poor data entry across legacy systems.
Here are the most common steps that you will have to take:
- Analyzing the root cause: identifying the source of the incorrect data and isolating or fixing it.
- Data parsing: implies data standardization and checks that it corresponds to the standards.
- Matching: detecting data duplicates and either merging them into one or deleting the unnecessary data.
- Data enhancement: adding the data from other sources to make it more accurate and valid.
- Monitoring: the process of keeping the data in correspondence to the standards and requirements.
If that sounds like too much, do not worry – there are plenty of available data quality management tools. For better results, it is highly recommended to use several tools at once as most of them are designed for a specific purpose (like data matching) and they cannot perform other functions.
Data validation
Data validation ensures that new or updated records meet defined quality rules before entering production systems. Modern organizations rely on automated data validation inside ingestion pipelines and transactional systems.
Validation checks include:
- Format and pattern rules (emails, phone numbers, identifiers);
- Range checks (financial amounts, sensor readings);
- Referential integrity (links between tables or master records);
- Business logic (e.g., a delivery date cannot precede an order date).
Strong validation reduces downstream defects, ensures data integrity, and prevents incorrect data from contaminating enterprise systems.
Data quality monitoring
You can keep enterprise data health under constant watch through real-time or scheduled data quality monitoring. Modern cloud systems run continuous checks on data reliability, latency, anomalies, and schema changes to catch issues the moment they appear.
Without monitoring, silent data degradation comes from predictable sources: pipeline failures, API updates, schema drift, upstream logic changes, and basic human errors.
Companies use monitoring dashboards and automated alerts to surface problems early, maintain compliance with standards like GDPR and CCPA, and ensure that analytics, forecasting, and reporting always run on accurate, up-to-date information.
Metadata management
Metadata management gives enterprise data the context it needs to be usable: clear definitions, lineage, ownership, usage rules, and access policies. Without this layer, even “clean” data becomes hard to trust or scale.
A strong metadata system underpins effective data governance and supports:
- Compliance with GDPR, CCPA, and industry-specific regulations;
- Impact analysis for schema or pipeline changes;
- End-to-end auditability and operational transparency;
- Faster onboarding for analytics, engineering, and reporting teams.
By defining how data is created, transformed, and consumed, metadata gives structure to information that would otherwise stay fragmented. Your teams no longer dig through disconnected systems or debate which record is “the real one.” Instead, metadata cuts through data silos, aligns cloud platforms with legacy systems, and anchors the entire organization to a single, reliable source of truth about how enterprise data moves, changes, and is used across the business.
Why do more checks make data quality worse?
In practice, most data quality initiatives begin with the simplest, most obvious checks. Null checks, row count verification between source and target, and basic format and type checks appear. This is a logical start: such checks are easy to automate, they quickly show “movement” and create a sense of control.
The problem begins later. As data quality scales, the number of these checks increases, but their business value diminishes. Metrics grow in number, reports become thicker, and alerts fade into the background. At some point, data quality is formally measured, but it no longer has meaning.
Metrics become drowned out by noise, reports become unreadable, and alerts are dismissed. Teams treat the “red status” as a background noise.
The key mistake here is checking what’s easiest to check rather than what the system needs to function. In practice, only those controls that “strike a nerve” are effective:
- data without which operations stop;
- fields that cause real losses of money, customers, or trust;
- metrics whose decline automatically triggers an incident, not just a schedule deterioration.
Effective data quality isn’t about the maximum number of checks, but about a minimum set of critical signals without which a business simply can’t function properly.
12 core data quality metrics for your business
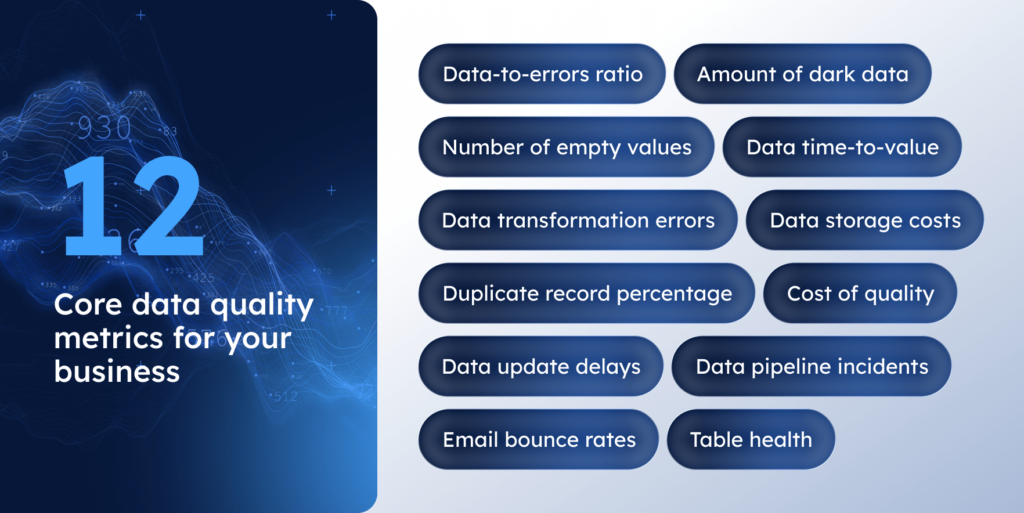
Data-to-errors ratio
This metric shows how much of your dataset is actually clean. To use this metric, you need to count the number of known errors (wrong values, broken formats, impossible dates) and compare it to the total number of records. In simpler words, if you scan 1,000,000 rows and tag 10,000 as wrong, your data-to-errors ratio is 100:1. When that ratio improves over time, you know your management process is doing real data quality improvement, not just ticking boxes.
Number of empty values
This metric tracks how often critical fields like email, tax ID, SKU, diagnosis code, or shipment date are left blank. Missing optional fields is harmless, but missing key identifiers usually points to broken forms, poor data entry, or failed imports. Monitoring these gaps early prevents bad data from spreading into analytics, reporting, and operational systems.
Data transformation errors
This one helps you measure how often ETL or ELT pipelines fail or produce invalid results, such as dropped rows, failed type conversions, or unexpected nulls. Pipeline errors for financial or healthcare data typically indicate unpredictable source data or non-robust transformations. You need to detect these early to prevent failure reports and regulatory issues down the line.
Amount of dark data
Dark data is everything you collect but never use. It’s stale logs or old exports. Or it’s a table that no dashboard has queried for a certain period. Monitoring it (like tracking zero-read datasets for 90+ days) will tell you where you’re adding storage without any real benefit. A lot of dark data is a symptom of something bigger: ambiguous ownership or a lack of data governance. Or no one actually thought about whether the data should be there. When you surface dark data, you’re really surfacing hidden quality problems and opportunities for cleanup.
Data storage costs
This is where your data quality management is linked directly to money on the table. You can compare how storage costs evolve versus the datasets and workloads that actually power analytics. If cloud bills rise but your active dashboards and models don’t, you’re almost certainly storing outdated, duplicated, or low-quality data. It’s a clear signal to archive smarter, deduplicate, and tighten your data quality framework and retention rules before costs get out of hand.
Data time-to-value
It’s time to find out how long it takes to turn raw data into something the business can use. You measure the time between data ingestion and its use in decisions, such as a supply chain dashboard, a risk model, or a campaign report. If analysts spend days fixing data accuracy, data completeness, and data validity issues before they can even start their work, your data quality control is happening too late in the pipeline.
Email bounce rates
This is a very practical metric for customer data accuracy. You can track how many messages fail due to invalid or outdated addresses to find out if something upstream is broken, like poor data capture, missing verification, or old records that have never been cleaned. If your bounce rate is rising, it means that your enterprise data needs stronger data cleansing practices and tighter master data management (MDM) to keep customer records reliable.
Cost of quality
This metric compares what you spend fixing data issues with what poor data costs the business, such as wrong invoices, audit problems, or broken reports. When the cost of errors outweighs prevention, you’ll need to start investing in data quality tools, automation, and governance.
Duplicate record percentage
In many datasets, the same person or object quietly appears more than once. When customer, product, or company records are duplicated, segmentation breaks, shipments get repeated, and analytics start telling conflicting stories. Even a modest duplicate rate indicates that data integrity is slipping.
Data update delays
Some data is technically correct but arrives too late to be useful. This metric captures the gap between a real-world event, such as an order or payment, and when systems actually reflect it. When that gap grows, data timeliness collapses, dashboards lose credibility, and teams end up making decisions based on yesterday’s reality.
Data pipeline incidents
Not all data failures are obvious crashes. Pipeline incidents include partial loads, silent truncations, or incorrect outputs caused by schema changes, legacy dependencies, or misconfigurations. As these incidents accumulate, data reliability and integrity erode, which make it necessary to ensure strong monitoring, automated rollback, and disciplined data governance.
Table health
If you look at individual metrics in isolation, they hardly ever tell you the full story. But table health brings multiple signals together: missing values, invalid records, duplicate rates, and data freshness. A high score means the dataset is safe for analytics, reporting, and AI, while a low score clearly shows where profiling, cleanup, or redesign is overdue.
8 most common data quality management challenges
Fragmented customer identity across systems
Most organizations have the same customer that exists across systems at once: CRM, billing, product analytics, support, and marketing tools. In these systems, this “same” person is captured with different IDs, formats, or update cycles, which creates conflicting views of reality, when one customer turns into three records, reports disagree, and trust in numbers drops.
Data silos and inconsistent definitions
Hardly anyone wants to produce data silos, but they grow naturally as teams adopt new tools and move fast. When the same metric or field means different things in different systems, for example, “active customer,” “order date,” or “revenue” stop being universal concepts. At that point, analytics requires a lot of effort to reconcile data, and decisions slow down because nobody is sure which number is correct.
Human error in data capture and updates
Data specialists still have to enter data manually, and it remains one of the biggest sources of quality issues. Human errors sneak into production every day as typos, skipped fields, and copy-paste mistakes. These errors rarely look critical at first, but once they go through pipelines, they become expensive to trace and clean up.
Duplicate records and over-counting
Duplicates appear slowly, and that’s where the problem lies. Imagine that a customer signs up twice, a supplier is entered under a slightly different name, a product SKU changes format. Such duplicates inflate KPIs, distort segmentation, and create operational errors like double shipments or inconsistent billing.
Inaccurate data that doesn’t match reality
There are times when problems with data are not visible because the values appear to be correct. Fields are filled, formats are correct, and nothing triggers an obvious error. But they could have the wrong address, the wrong status, an unrefreshed price. These are the dangerous ones because they bypass the validations and your teams take actions based on data that seems accurate but really isn’t.
Incomplete data and missing critical fields
Unlike the challenge above, the data that you miss is one of the most visible problems, but also one of the most disruptive. When key fields like IDs, dates, or status codes are empty, joins fail, reports break, and analysts spend time patching instead of analyzing. In many cases, missing values point directly to broken forms, weak validation, or poorly designed ingestion processes.
Silent data drift over time
Some data problems may distort results, but still run through pipelines. An upstream team renames a column, changes a business rule, or starts sending new values in the same field. Everything still runs, but the meaning of the data shifts. Teams discover the issue only when reports contradict reality or models start behaving unpredictably.
Weak ownership and governance in practice
Data quality issues often spiral out of control when one team thinks another owns the dataset, problems get passed between teams, and nothing gets resolved. Even organizations that have great tooling and clean pipelines often have nightmares with data quality because no one takes ownership when the numbers start to go off. True data governance doesn’t happen through governance documents and meetings, you should have your teams align on who owns the data when it’s not reliable.
12 best practices for maintaining high data quality
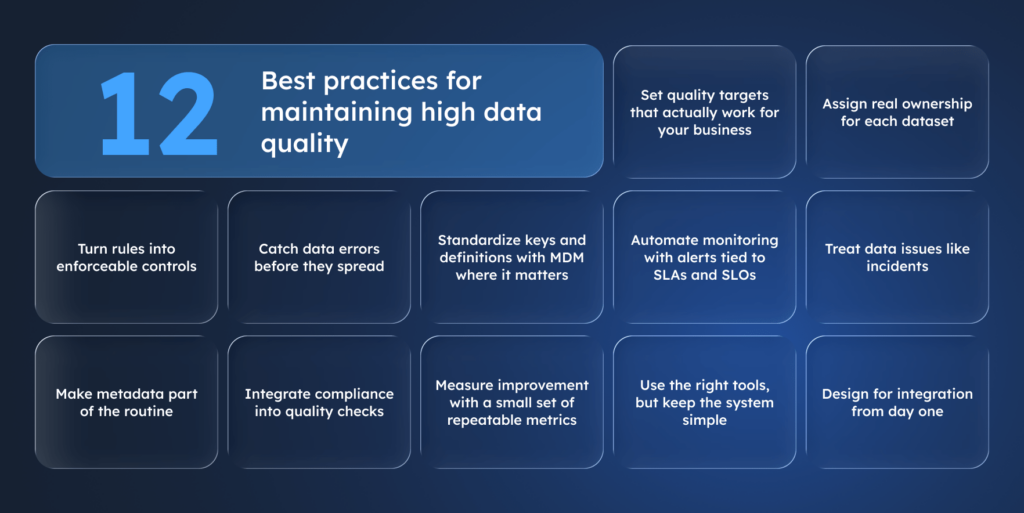
Set quality targets that actually work for your business
Perfect data sounds nice, but it rarely pays off. Define quality thresholds for data accuracy, data completeness, data consistency, data timeliness, and data validity based on how the dataset is used. Note that real-time operations need stricter rules than long-term analytics or reporting.
Assign real ownership for each dataset
Without a clear owner, issues get passed around like a hot potato. Appoint a person responsible for each dataset who can approve definitions, accept risks, and push fixes, otherwise issues just bounce between teams and data reliability never stabilizes.
Turn rules into enforceable controls
Write clear rules for formats, ranges, relationships, and business logic, then enforce them with automated data validation. Don’t wait until BI tools or reports catch the problem, fixing problems at the point of entry saves you from having to fix them later when they appear in reports or customer complaints.
Catch data errors before they spread
Catching errors after data lands in dashboards or systems is already too late. Run checks when data’s first ingested or transformed so you can prevent bad data from spreading through your pipelines. It’s like stopping a leak before it floods.
Standardize keys and definitions with MDM where it matters
Not everything needs master data management, but customer, product, and location records should be clean from the start. This is where duplicates and inconsistencies cause the most trouble. So, the best option for you is to manage these from day one.
Automate monitoring with alerts tied to SLAs and SLOs
You don’t find data problems by checking once a month. Use real-time monitoring to track data freshness, schema changes, missing values, and unusual patterns. Alerts should tell you exactly what went wrong and why it matters.
Treat data issues like incidents
When the same data issue pops up repeatedly, treat it like a major incident, not just a backlog item. Investigate it, assign severity, and take responsibility. Root cause analysis and postmortems stop the same problems from coming back.
Make metadata part of the routine
If definitions and lineage aren’t documented and easy to access, data becomes harder to trust. Set up a shared catalog for metadata, with clear ownership and rules. This clears up confusion and keeps things consistent across teams.
Integrate compliance into quality checks
Tie data quality controls directly to data governance and compliance needs. Quality checks should enforce consent, retention, access, and audit rules by default. This way you catch compliance gaps at ingestion and transformation and avoid dealing with them during a GDPR/CCPA request or an internal audit.
Measure improvement with a small set of repeatable metrics
Track a few signals that teams can’t ignore: duplicate rates, empty critical fields, pipeline incidents, freshness delays, and defect density. If those move in the right direction, data quality improvement is real.
Use the right tools, but keep the system simple
Choose data quality tools that cover profiling, validation, monitoring, and workflows. Then standardize how teams use them so managing data quality stays predictable, not chaotic. If every team invents its own rules and naming, you end up with tool sprawl and “quality” signals nobody trusts.
Design for integration from day one
Plan how data flows between cloud platforms, legacy systems, and operational apps like ERP, CRM, and supply chain systems. This way, changes won’t break your data quality every time a new source or feed is added.
10 proven tools for data quality management
Tools for rule-based validation
The tools below enforce explicit expectations: null checks, ranges, uniqueness, formats, and business constraints. They work best when “good data” can be written down as rules.
Great Expectations
This tool helps you treat data quality like testing. You define checks (not null, ranges, unique, patterns, custom rules), run them in pipelines, and get clear validation reports when something breaks. Teams like it because it keeps data quality control close to ETL/ELT logic, so bad records fail early instead of showing up later in dashboards.
Soda
It focuses on fast, readable checks you can run directly against your warehouse or lakehouse using familiar, SQL-style rules. The tool works well when you need a lightweight way to monitor data accuracy, data completeness, and freshness across many tables without building a heavy framework from scratch.
Amazon Deequ
That’s a good fit for Spark-first environments where data already flows through large distributed jobs. It profiles and validates at scale, so teams can catch constraint violations (null spikes, broken ranges, unexpected values) before curated tables or feature sets get polluted.
dbt
dbt tests cover the transformation layer where problems often begin: mismatches in joins losing data, growing models repeating IDs, links failing without warning. Teams use dbt tests because they run as part of the modeling workflow and make quality failures obvious at the exact point, when analytical tables are generated.
Tools for anomaly detection
Anomalo
Teams need this tool for automated anomaly detection, which helps when they can’t realistically hand-write checks for every column across hundreds of datasets. It flags distribution shifts, unusual missingness, and behavior changes that pass basic validation but still break trust in reporting and models.
Bigeye
With Bigeye, you can track clear targets like how fresh or complete data should be. When issues appear, notifications go straight to those accountable. This approach suits teams needing oversight tied directly to responsibility, and they can easier track the impact on operations this way.
Tools for observing pipeline and data reliability
Monte Carlo
This one targets production monitoring rather than rule-writing: it watches for freshness delays, volume anomalies, schema changes, and pipeline incidents, then points to likely root causes. Teams choose it when they want fewer “numbers look weird” escalations and faster answers about what changed and which downstream reports got hit.
Acceldata
It combines data quality signals with pipeline and platform health, so teams can see latency, failures, and throughput issues alongside quality outcomes. It’s used in larger environments where data quality includes operational stability across complex stacks, not just column checks.
Databand
To tie orchestration and data health together, use Databand. It tracks pipeline failures, delays, schema drift, and table freshness in one place. With this tool, teams can shorten the path from “job failed” to “table stale” to “dashboard impacted,” so incidents stop bouncing around without clear diagnosis.
Tools for detecting change and regression
Datafold
If you need to catch regressions during change, Datafold is a good helper for your teams. It helps compare datasets before and after code updates and shows exactly what shifted. Teams use the tool because it prevents “we shipped a small change and half the metrics moved” situations by making differences visible during reviews and releases.
Data quality management team: the main roles
Even though it is not obligatory to have a dedicated data quality management team, it would be much easier to handle the data if you assign the key roles. Though the composition might vary, the most common roles are:
- Data owner: a senior-level executive who controls data quality and ensures it corresponds to the standards. The data owner represents the business side. They define what good data means, approves quality thresholds, and accepts the business risk when data is incomplete or inaccurate.
- Data consumer: a person who uses the data but also reports about the errors and defines data standards. They often help define practical standards based on real usage, not theoretical models.
- Data producer: a person who captures the data and makes sure it complies to the requirements of data consumers. This specialist represents IT and operational systems that create or ingest data. Most data quality issues start here, which makes this role critical for prevention rather than cleanup.
- Data analyst: a person who is responsible for analyzing and assessing the data. Data analysts sit between business and IT. In many teams, they become the early warning system when data drifts but hasn’t fully broken yet.
Data quality management: general guidelines to follow
The process of managing the quality of your data is rather complex and does not end on data assessment and remediation. In order to always have correct and accurate data at your disposal, it is recommended that you follow certain guidelines on data quality management.
Emphasize the importance of data quality management on all levels
It’s not enough if only a few people in the company understand the importance of data quality and the possible risks that incorrect data brings. In order to mitigate these risks and derive more value from the available data, it is critical to make data quality a top priority and ensure that everyone understands that.
To start with, you can create an enterprise-level strategy on data quality management and make it available for all the employees. Next, assign user roles and assemble a data quality team that we mentioned above. You will also need to work on a data quality management process that will be designed specifically for your company. And obviously, you will need an efficient system to manage these processes.
Automate the data entries
Human errors are a common thing especially if that means manual data entries and a massive number of records. Therefore, one of the simplest yet most efficient ways to prevent the appearance of errors is to automate the data entries. For different companies, the automation would be different so you need to carefully think about what you can really automate and whether you have resources to do so.
You can also implement duplicate prevention by creating certain duplicate detection rules and applying them to your system.
Focus on preventing errors
Instead of reacting to an issue, smart companies do their best to prevent the occurrence of the issues. As a result, they are able to minimize the number of data-related errors and significantly improve their processes.
Some of the preventative methods in terms of data quality management include:
- Always do the root cause analysis for every issue in order to identify the source of the problem and eliminate it,
- Try keeping a data quality issue log to stay well-informed about the issue itself and its resolution,
- Come up with data quality KPIs and try linking them to the business KPIs.
Summing up
Data quality management is an obligatory practice for any company that relies on the data and wants to enhance its strategy with accurate business decisions. But due to the complexity of the process, it is highly recommended to create a solid strategy on implementing the data quality management and find the necessary tools that will help you seamlessly manage it.
Data is the driving force of the modern business world, so do not miss the chance to get the maximal value from it. But in order to do so, you will need a reliable technological partner who offers will be able to offer the most suitable solution for your business needs. SoftTeco has over 10 years of experience in working with the data and its management and we will gladly design a custom data management solution specifically for your business.


Comments