
Data analytics is a systematic process of examining, processing, and interpreting data to find patterns, correlations, and associations. It helps organizations find answers to business questions, make better decisions, understand their customers’ expectations, and build a grounded, data-driven strategy.
A wide range of data analytics applications – from tracking KPIs to predictive maintenance – makes it harder to define what type of analytics your business needs. Read on to discover the main types of analytics to run your business confidently.
Key takeaways
- There are 4 types of data analytics: descriptive, diagnostic, predictive, and prescriptive. Each type answers one business question and relies on its own tools and techniques.
- For accurate data analysis, companies need to collect, clean, and transform their data. Data quality management standards are applied to prepare raw data for the analysis.
- Each data analytics type varies in purpose and complexity. Selecting the right one depends on your goal, data readiness, and the desired outcome.
- Different types of data analytics are rarely used in isolation. Businesses often apply them in pairs or create a connected cycle from all four types to support guided decision-making.
Why data analytics matters in 2026
Why do businesses need to implement data analytics tools? Just think about the speed at which customers’ decisions and behavior change: what was trendy and top-selling yesterday can become obsolete in days and weeks. In a highly competitive market, businesses need to quickly adapt to changing demand, detect trends, and identify opportunities and risks early on. Here’s when data analytics comes to the spotlight. And there are some solid reasons behind it.
- Data volume. Around 221 zettabytes of data will be generated in 2026 from mobile apps, platforms, customer transactions, social media, and IoT. Without proper analysis, it quickly turns into dark data, holding your business back rather than moving forward.
- AI dependence on data. While 88% of companies already use artificial intelligence in at least one business function, modern AI systems, from agents to ML models, heavily rely on quality data. Data analytics produces outcomes AI can actually learn from.
- Need for instant decisions. Today, markets move faster than ever before: shifting prices, demand, and trends require organizations to react instantly to changing conditions. In domains like finance and logistics, real-time analytics is a must.
- High competition. Tight market conditions leave small room for error, making guesswork costlier than ever. Different types of data analytics allow businesses to make better decisions, improve customer targeting, and strengthen their market position.
- Emergence of new risks and challenges. Data analytics lays the foundation for fraud detection systems, compliance checkers, and cybersecurity monitoring tools, helping to detect anomalies early and reduce damage.
To obtain the maximum value from data analysis, companies need to choose the appropriate data analytics method. Below, we will provide an overview of all four types in detail.
Descriptive analytics
Question answered: what happened?
Techniques: data mining, data aggregation, statistical analysis, frequency distribution
Tools: MS Excel, SPSS, MATLAB, STATA
Descriptive analytics is the simplest yet fundamental form of data analytics. It summarizes historical data without explaining causes or predicting outcomes. You just define what you want to study, collect all relevant data, refine your dataset, and apply statistical techniques to turn the results into reports, dashboards, and charts.
They can show the most profitable marketing channels, the peak tourism seasons, or the most popular product among the customers, depending on the goal. Still, it is important to remember that descriptive analytics does not explain why a particular event, such as customer churn, occurred – it simply states it and nothing more.
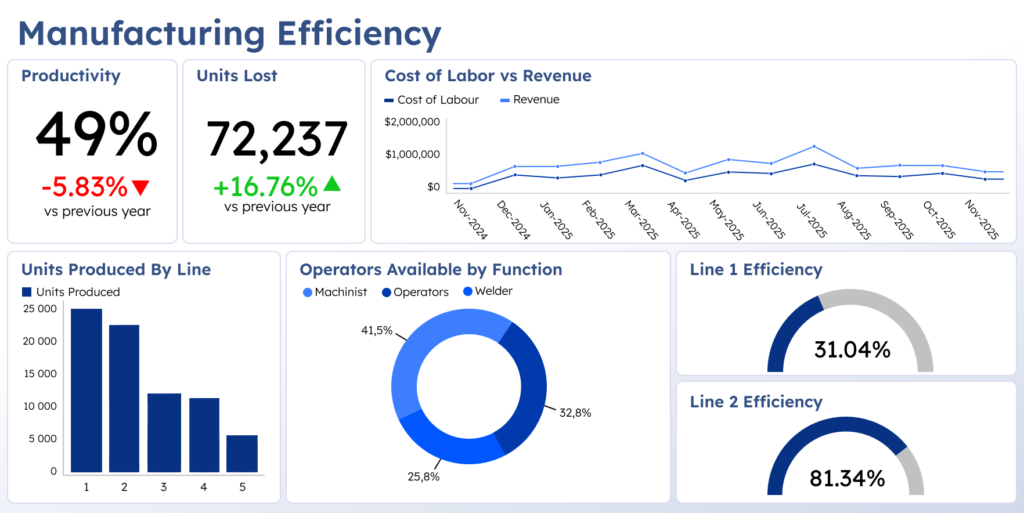
Despite being the simplest type, descriptive analytics is used in many daily business operations. It serves as a foundation for more advanced analytics. For example, an enterprise wants to define bottlenecks in the onboarding process. They gather newcomers’ survey results, support tickets, and user activity data to find out that there’s a complex approval process that sprawls the workflow and delays work.
In what areas can descriptive analytics be applied? It fits businesses across any industry, providing basic reporting for sales, marketing, finance, HR, and operations. Here are some examples.
- Healthcare. Assessing admission rates or emergency visits to detect spikes and allocate more staff for that time.
- Ecommerce. Identifying what items sold best, when, and where, to adjust promotions accordingly.
- Banking and finance. Analyzing monthly spending trends to detect unusual activity or understand customer segments.
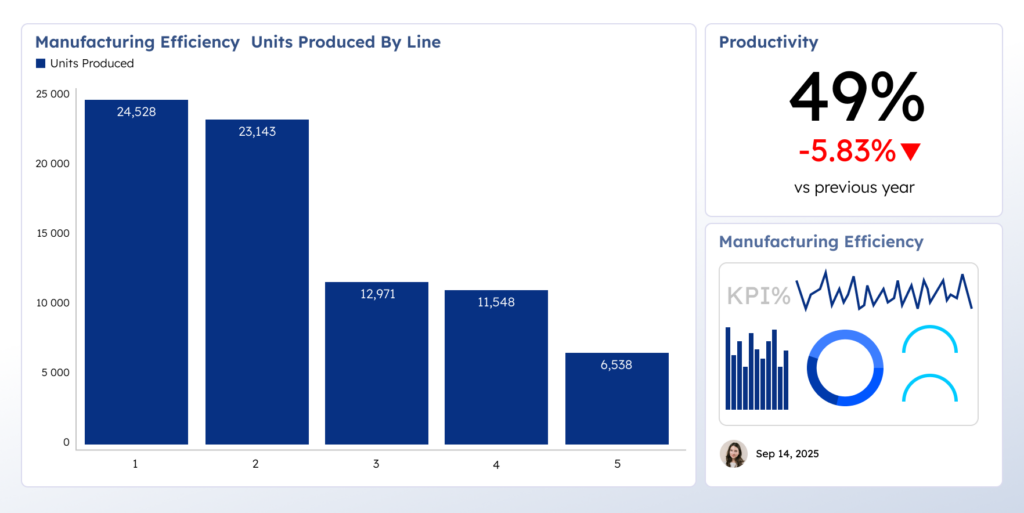
- Manufacturing. Monitoring production, quality, and efficiency to identify output by production line, defect rate, machine uptime, and downtime.
Diagnostic analytics
Question answered: why did it happen?
Techniques: drill-down analysis, correlation analysis, data discovery, root cause analysis, time-series analysis
Tools: MS Excel, Tableau, Power BI, Google Analytics
Diagnostic analytics helps identify likely causes of an event and explain why it may have happened. It facilitates digging into historical data and contributing factors to identify patterns and relationships, understand certain outliers, and receive advanced insights into an issue.
For diagnostic analysis, you should first identify the problem. Then, you need to collect and clean the relevant data to obtain accurate, reliable results. Next, apply fitting techniques, like root cause analysis or time-series analysis, to find causes, correlations, and anomalies. Finally, visualize the findings and convey the story behind the numbers.
Diagnostic data analytics resembles both research and investigation. Let’s say an ecommerce store owner has detected a sudden 20% drop in conversion rates. First, the data analysts conducted a funnel segmentation. It helped to identify the exact issue location, which turned out to be iOS Safari.
Next, when checking page performance, they noticed that the checkout page load increased by 4s, which correlated with the frontend release. This fact suggested a potential regression affecting iOS Safari rendering or resource loading. After inspecting the logs, they found a broken payment API call that occurred only in iOS Safari sessions. Once the identified issue was fixed, conversion rates returned to normal.
Note that these assumptions are based on historical data and should be treated as evidence-based explanations, not absolute proof of causality. Moreover, diagnostic analysis can be time-consuming and difficult to implement due to complex data, challenges separating cause from effect from coincidence, and the need for advanced techniques.
Here are the most common use cases for diagnostic analytics:
- Learning why app performance drops. Find the root cause by measuring the issue scope, segmenting the data, and analyzing contributing factors.
- Assessing marketing campaign performance. If you get fewer clicks than expected, diagnostic analytics helps identify performance patterns and test and validate causes.
- Exploring productivity shifts. With analytics techniques, you can localize the department/shift/location where performance dropped, align it with operational changes, and drill into workflow-level metrics to find the cause.
- Identifying causes of supply chain disruptions. Data analytics here can help identify process bottlenecks and anomalies, compare suppliers and routes, and validate contributing causes to find and fix the issue.
Predictive analytics
Question answered: what might happen?
Techniques: classification models, decision trees, neural networks, regression analysis, clustering models, time series models
Tools: Amazon Forecast, IBM Watson Studio, HubSpot CRM, Salesforce Einstein Analytics
Unlike previous analytics categories, predictive analytics is a much more advanced type that not only describes but also provides possible future outcomes. Companies can better understand the kinds of results they might expect in the future and the actions that might deliver them. With predictive analytics, businesses forecast demand for goods and services, build recommendation engines for their streaming platforms, and even predict flight delays.
The workflow here resembles that of other data types: you start by identifying issues, collecting data, and cleaning. Then you choose a modeling technique and use the datasets to train a predictive model. After testing and fine-tuning, you translate the model’s output into business actions.
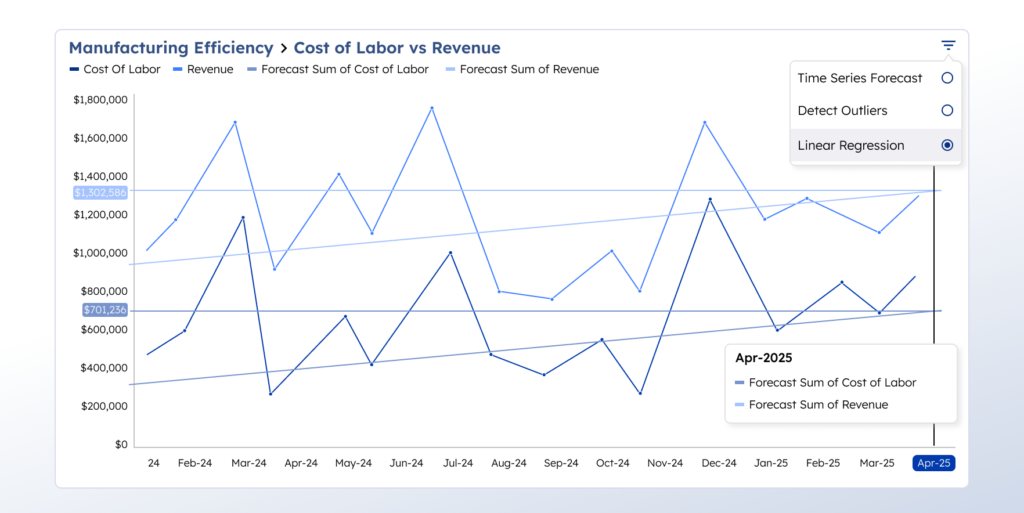
Due to its complexity, predictive analytics requires advanced tools such as artificial intelligence, machine learning, and cloud computing. It heavily depends on data quality and requires advanced expertise to perform. Moreover, predictive algorithms don’t give a definite judgment or a 100% accurate forecast. Instead, they use historical data to make assumptions about what might happen if certain conditions are met.
Some of the predictive analytics use cases include:
- Predictive maintenance. The model continuously collects metrics such as temperature, pressure, vibration, and noise levels, analyzes them, and predicts failures, enabling maintenance scheduling before failure.
- Credit scoring. An ML model analyzes a customer’s credit history, demographics, income, and employment status and assigns a credit score or risk probability to each applicant.
- Delivery time prediction. You create algorithms that analyze historical and real-time data to estimate delivery dates, the likelihood of delays, or delivery time ranges.
- Disease risk prediction. In healthcare, predictive analytics is used to forecast the development of a health condition based on a patient’s medical history, lab test results, lifestyle, and demographic data.
Prescriptive analytics
Question answered: what should we do?
Techniques: optimization models, decision analysis, simulation, ML algorithms, scenario planning
Tools: Power BI, SAP Analytics Cloud, Tableau
Based on the outcomes from predictive analytics, prescriptive analytics provides recommended actions and supports business decisions. This is the most complex type of data analytics that constantly keeps “learning” through the received feedback and incoming data.
A prescriptive analytics model predicts a likely situation and suggests what should be done and what conditions are needed. As a result, business owners receive a data-supported recommendation. They can better identify opportunities that might bring value to their business.For example, in logistics, prescriptive models give recommendations on optimal routes based on traffic, distance, and delivery priorities. It allows companies like DHL to lower fuel use and deliver packages faster with fewer delays.
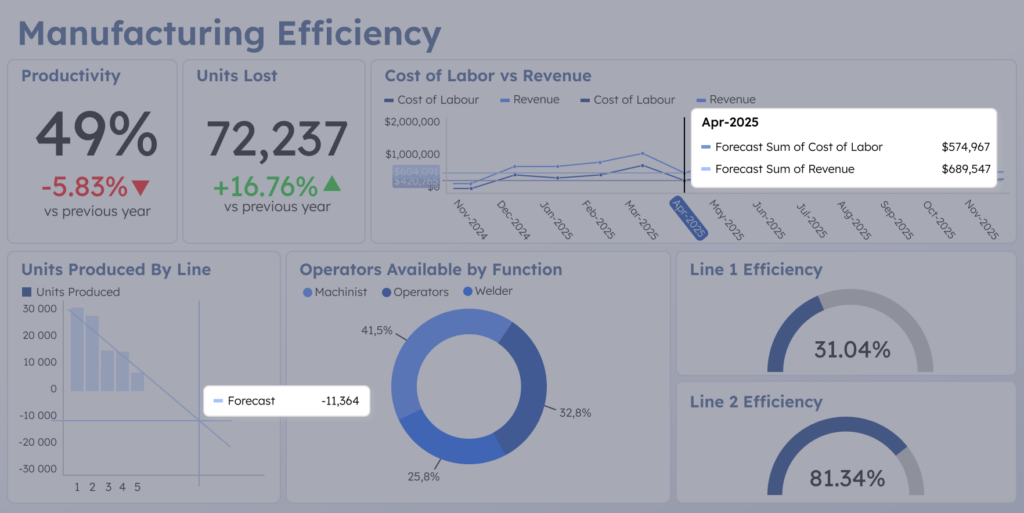
But it’s not only about benefits. Prescriptive analytics is the most complex and most expensive type of analytics to implement. It requires advanced technology and extensive expertise to implement. Prescriptive analytics models produce assumption-based outputs that may not always be practical or accurate if conditions change.
Among other types of data analytics, prescriptive analytics stands out in:
- Inventory optimization. Smart algorithms advise on optimal ordering and stocking. The reasoning behind this is based on analyzing demand patterns, supplier reliability, inventory turnover rate, and possible constraints.
- Feature prioritization. For product management, prescriptive analytics estimates feature value signals and calculates effort/costs, so your team can select features that deliver the most business value.
- Treatment recommendations. ML models can suggest optimal treatments and create personalized treatment plans by processing symptoms, lab results, vital signs, and medical imaging.
- Cash flow optimization. For banking and investment institutions, prescriptive analytics leverages financial data like cash inflows/outflows, evaluates the working capital cycle, and creates financial scenarios to improve liquidity and overall financial stability.
How to choose the right data analytics type for your business
Each data analytics type differs in purpose and complexity. The choice may depend on the question you want to answer, the business stage (startup, growth, maturity), and data readiness. To choose the most suitable option and avoid wasting time, budget, and internal resources, you should answer the following questions:
- What kind of complexity do you expect from your data insights?
- Why do you need to analyze the data? What goal are you setting for your company?
- What is the current data analytics state of your company?
- How are you planning to use the insights, and what is your future strategy?
Remember that you can combine different data analytics types according to your business needs. In this case, it’s vital to assess the accuracy, completeness, and consistency of your enterprise data to achieve reliable results. Data collection and refining will be easier when you already have a robust big data strategy. Still, you can also assign experienced data engineers to help you with that.
| Type | Core question | Focus | Methods | Output |
|---|---|---|---|---|
| Descriptive analytics | What happened? | Past | Aggregation, dashboards | Reports, KPIs |
| Diagnostic analytics | Why did it happen? | Past (causes) | Drill-down, correlations | Root cause insights |
| Predictive analytics | What might happen? | Future | Regression, machine learning | Forecasts, probabilities |
| Prescriptive analytics | What should we do? | Action | Optimization, simulation | Suggestions, decisions |
Tips for successful implementation of data analytics
Data analytics implementation might be more complex than it seems at first glance. Here is advice to help you navigate through.
Classify your business data first
Put all your business data into three broad categories to make it easier to analyze later: reference data, master data, and transactional data. Reference data refers to the controlled vocabulary of your system, such as country and currency codes; master data includes customers, suppliers, and products; and transactional data includes purchase orders, payments, and shipments.
Make compliance a core principle of analytics
Your data is both an asset and a liability. As analytics often uses sensitive financial, personal, or health data, it’s crucial to comply with data protection regulations such as GDPR, HIPAA, and GLBA. A responsible approach to data handling helps you build trust with customers and partners, avoid lawsuits, and even prevent full operational shutdowns.
Regularly refine analytics models
If your organization already uses AI models for predictive or prescriptive analysis, ensure they are staying up to date. You should adjust the model to evolving business needs and challenges, and prevent data drift, bias, and over- or underfitting. Introduce continuous algorithm monitoring, retraining, and updates to keep them reliable over time. Remember that analytics models aren’t static assets – they’re dynamic systems that fit specific business problems and data.
Set a single source of truth
Conflicting metrics across teams don’t add up to accurate analytics or data trust. Creating a single source of truth ensures shared understanding of data and alignment of decisions across the organization. Your business gets agreed definitions (KPIs, entities, and segmentation logic), a dataset, and a calculation method for the core business data points.
Use data-driven narratives
While all types of data analytics deliver insights in the form of model outputs, aggregated tables, and statistical results, they require interpretation and explanation to support analytical judgment. Use data visualization, context, and examples to create data-supported storytelling and communicate insights to stakeholders. Turn raw findings into clear narratives that explain the insight, its context, and business implications.
AI use in modern data analytics
AI can enhance data analytics at almost every level, from data gathering and cleaning to exploratory data analysis and predictive modeling. Moreover, thanks to copilot features introduced in many products, it has become much easier to develop and use analytical tools.
Still, when it comes to artificial intelligence, human oversight is needed for business problem statements, data quality evaluation, and bias detection. AI tools continue to struggle to understand specific business situations, and LLMs can make mistakes in mathematical calculations. In addition, data analytics remains a risky area for full automation, as analysts work with sensitive business data and multiple data sources, where end-to-end AI automation can create security, governance, and accuracy risks.

Benefits of data analytics
Each of the four types of analytics can bring advantages for businesses of any size or domain. Combined with data visualization tools, they provide insights that help companies allocate budgets, set prices, and target customers.
Accurate business decisions
With data analytics, senior management can make decisions based on the actual customers’ needs and market dynamics – not on assumptions and guesswork. Dashboards and reports help to align teams on KPIs and better track outcomes against targets. It all could lead to performance transparency, service improvement, and cost reduction. In fact, 43% of companies report gaining a competitive advantage by using data analytics.
Risk mitigation
According to the research, U.S. companies lose approximately 9.8% of their revenue due to fraud. At the same time, the global cost of data breaches reached $4.4 million in 2025, making the mitigation of financial risks and early fraud detection and prevention a priority for any business. Data analytics enables the creation of audit trails and automated alerts, helping companies reduce exposure and support compliance.
Another study shows the significance of data analytics for cybersecurity. Here, the CNN model achieved 85% accuracy in detecting threats when learning on synthetic data. The precision increased further, to 95%, when real-world data was used for learning. The implementation of data analytics combined with ML algorithms reduces risks of data breaches, detect malware, unauthorized access, and insider threats.
Data analytics can also mitigate operational risks caused by human error, equipment malfunction, or process breakdowns. Deloitte reports that advanced analytics can increase equipment uptime by 10–20%, reduce breakdowns by 70%, and lower maintenance costs by 25%. The effect is reached through turning raw equipment data into forecasts when the machine is likely to require service, degrade, or fail.
Personalized offers
In the age where personalization becomes a new standard – and for a good reason. 71% of customers expect businesses to provide personal interactions. From retail to banking, companies rely on data analytics to make customized recommendations and tailor pricing, offers, content, and services. By understanding preferences and analyzing user behavior, companies can increase revenue and build strong customer relationships.
Proactive issue detection
Healthcare, IT and telecom, and BFSI are the leading industries in the data analytics market, and for good reason. Predictive and prescriptive analytics help businesses pinpoint and resolve issues before they cause serious disruptions. Analytics models can monitor metrics on performance degradation, system behavior changes, and error rates, therefore preventing operational costs from increasing and reducing downtime.
Final word
Data analytics is a valuable asset that helps companies make accurate decisions, mitigate risks, and better understand their customers and internal processes. From our experience, we would say that data analytics is a must for any modern company. Still, the type of analytics you choose will depend heavily on your available budget, resources, and business goals.
Different types of data analytics focus on specific questions and produce distinct outcomes. Nevertheless, your organization might get the most from combining several types, such as descriptive and diagnostic, or from creating a full analytics cycle that includes all four types. One thing they all have in common is the need for consistent, standardized data.
The most efficient way to build a scalable data processing and analysis pipeline is to hand it over to the professionals. SoftTeco designs and implements data analytics workflows, helping businesses at every step, from data preparation to data visualization. Reach out to get a non-binding, free consultation on your project.






Comments